Tracking Companies’ Exposure to Japan
As you may have seen in the news, the Trump Administration is warning Japan that 25 percent tariffs will start against the country on Aug. 1, presumably as a negotiating tactic to pressure Japan into cutting some sort of trade deal with the United States before then.
Will this deadline stick? We don’t know. Will that 25 percent tariff rate endure? See previous statement.
But Calcbench can help financial analysts get at least some sense of U.S. corporations’ exposure to retaliatory tariffs, by tallying up revenues that U.S. firms report from the Japanese market.
We simply visited our Segments, Rollforwards, and Breakouts page, pulled up the geographic segments reported by the S&P 500, and filtered the results by the word “Japan.”
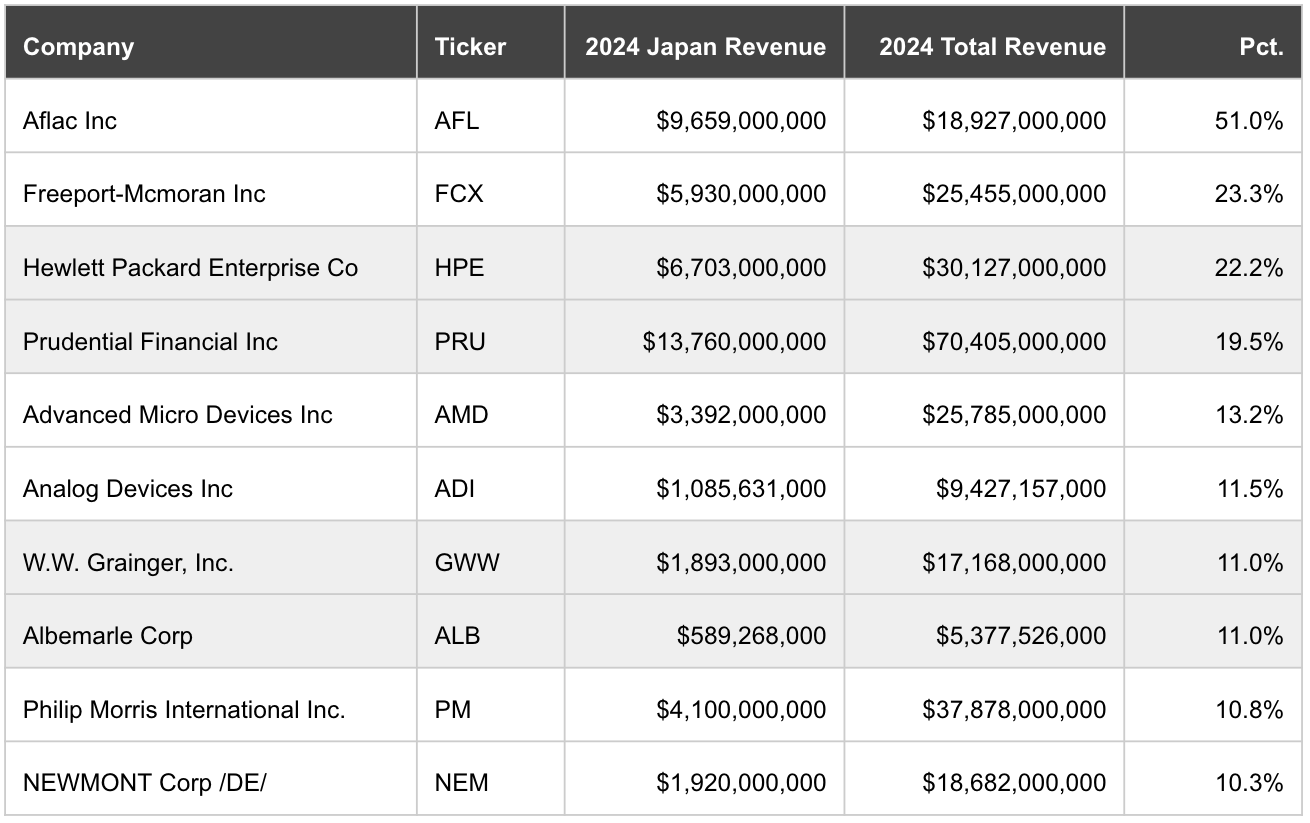
Table 1, below, shows the 10 firms with the greatest percentage of 2024 revenue coming from the Japanese market.
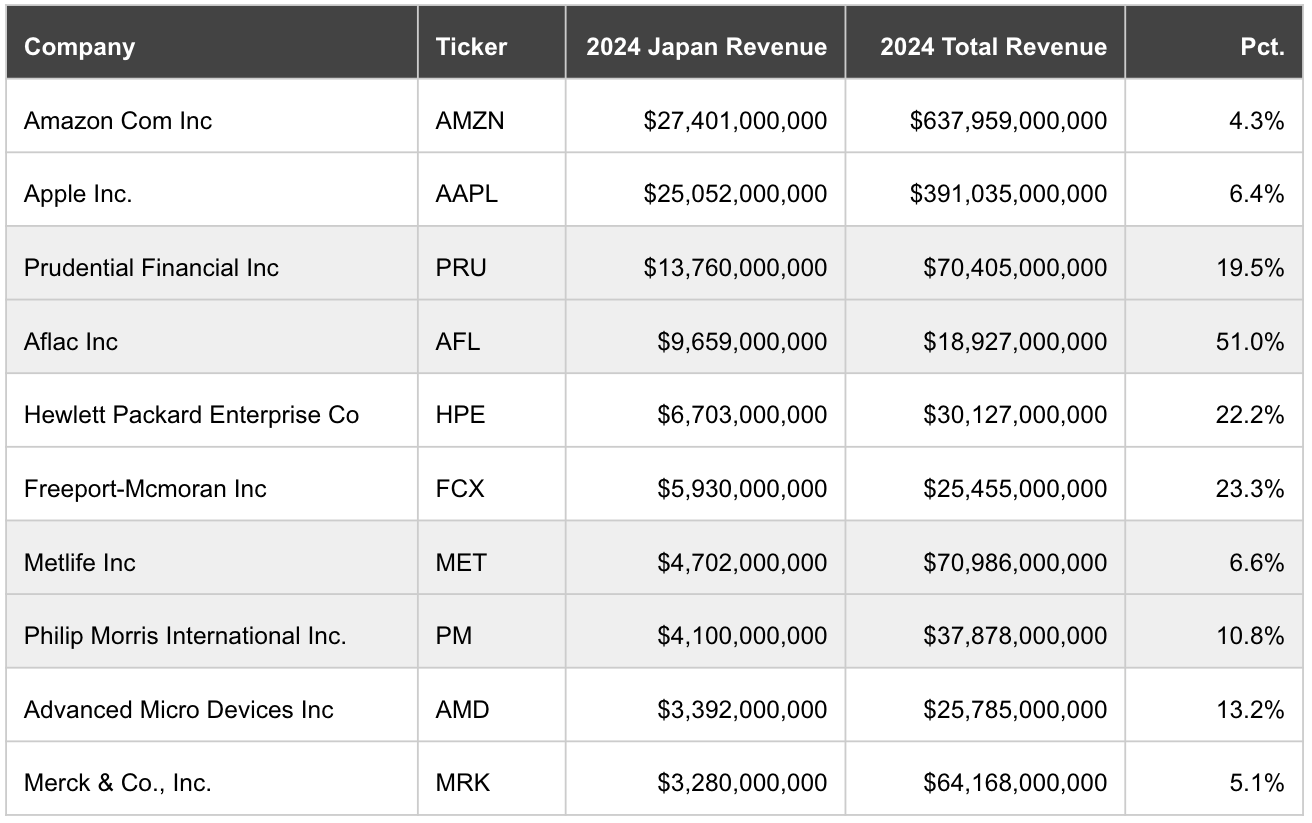
On the other hand, we could also rank firms by their Japan revenue in absolute dollar terms. That gives us Table 2, below.
As we’ve warned before, analyzing geographic segment disclosures is an inexact science because not all firms define their geographic segments in the same way. For example, all the firms above do report a segment defined as “Japan” — but other companies might report a segment called “Asia-Pacific” that includes Japan, along with other countries. Some might include China in Asia-Pacific; others might report the two regions separately.
Still, we can say that these S&P 500 firms (we identified 35 in total, including the firms above) do report large Japan segments that account for a material portion of total revenue.
Calcbench subscribers can run the same sort of analysis on any number of countries or trading blocs: China, Mexico, Europe, and so forth. It’s another level of detail that can help analysts understand a company’s financial performance and earnings potential, made possible through Calcbench.

Comments
Post a Comment