Posts

Showing posts with the label restaurants

A Taste of Restaurant Inflation Pressures

Image
Calcbench was feeling a bit peckish this week for insights into the macro-economic environment, so how better to pass the time then sifting through the earnings releases from restaurants to see what they had to say about inflation?  Various restaurant chains offer inflation forecasts as part of their earnings guidance. A good example of this is Darden Restaurants ($DRI). Last summer, at the end of its fiscal 2025, the company had forecast inflation for its upcoming fiscal year at 2.5 to 3 percent. By the end of its fiscal Q1 2026 in September, Darden nudged the forecast upward to 3 to 3.5 percent. Darden filed its latest earnings release this week, for its fiscal Q3 2026. It now forecasts inflation at 3.5 percent .  That led us to look for other disclosures at other restaurants. Sure enough, we found them. Texas Roadhouse ($TXRH) included inflation estimates in its 2025 full-year earnings release filed on Feb. 19. The company predicts wage and labor inflation costs of 3 to...
Sit-Down Restaurants Go on Diet

Image
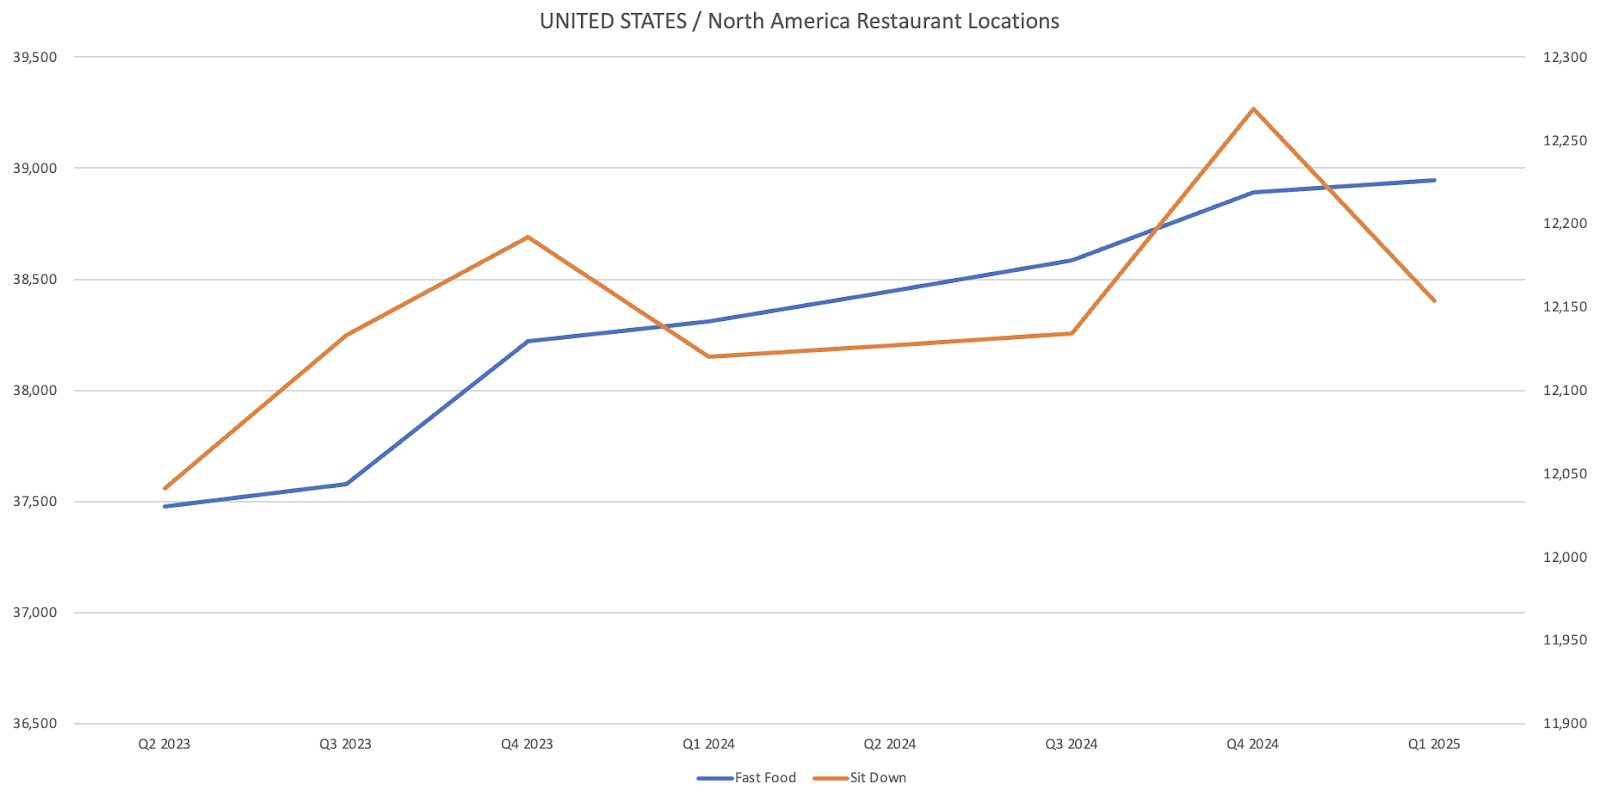
Last month Calcbench had a post looking at major restaurant businesses and the number of locations they operate in North America. Today we have an update specifically on the number of sit-down restaurants in the North America market — because they showed a sharp decline in first-quarter 2025.  Figure 1, below, tells the tale. It charts total restaurant locations for two dozen restaurant businesses for the last eight quarters, grouped into fast-food (blue line) and sit-down (red line) categories. Note the precipitous plunge for sit-down restaurants in the first quarter of this year. (The number of sit-down locations is listed on the right-side axis.) The restaurant companies in our sit-down category include  Cava ($CAVA), Dave & Busters ($PLAY) and Darden Restaurants ($DRI), which operates the Olive Garden, Capital Grille; among others.  Long story short, the number of sit-down locations has see-sawed in a relatively narrow band for the last two years: from 12,041 ...

Counting Restaurant Openings

Image
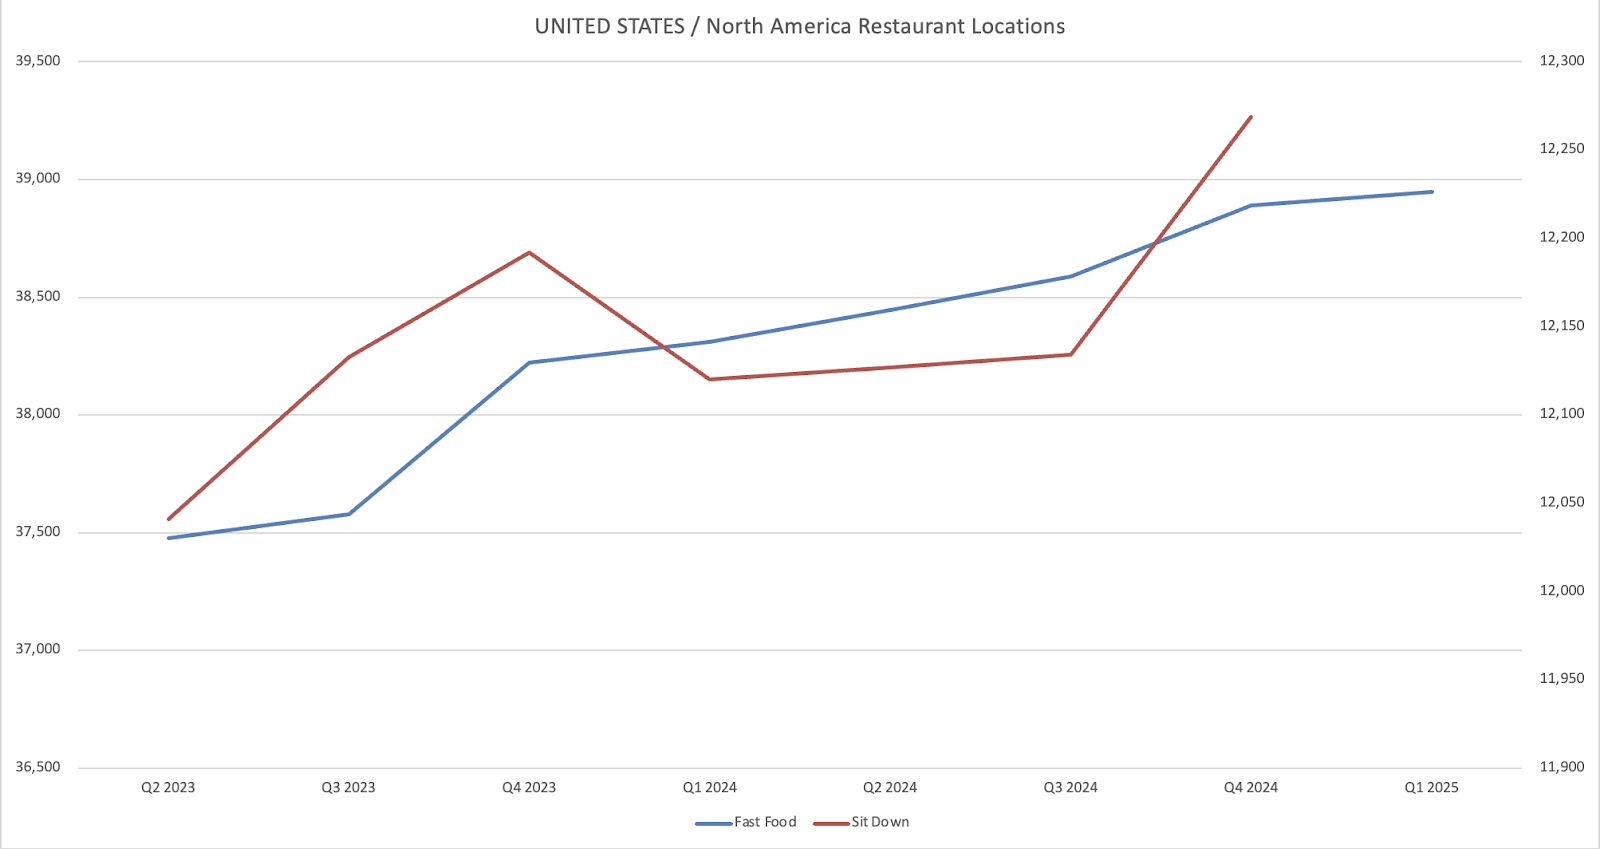
Restaurants are a big business in North America — and Calcbench can help you understand just how big, by tracking the total number of restaurants that publicly traded food businesses are opening or closing from one quarter to the next. Publicly traded restaurant companies do report their total number of restaurants each quarter in their earnings releases. This means Calcbench can collect and crunch those numbers with just a few keystrokes, which is what we did one afternoon after rolling ourselves back to the office from a calorie-laden lunch. Figure 1, below, charts total restaurant locations for two dozen restaurant businesses for the last eight quarters, grouped into fast-food (blue line) and sit-down (red line) categories.  For those who can’t squint enough to see the numbers on the vertical axes, here is the same information displayed in a table. (As you can see, we are still waiting for enough Q1 data from the sit-down restaurants to add that component to the chart and table....