Posts

Showing posts with the label Pharma

Booming GLP-1 Sales at Lilly

Image
Mounjaro Sales Q2-26 $9.94B Zepbound SALES Q2-26 $4.93B All other SALES Q2-26 $6.98B Eli Lilly & Co. filed its Q2 earnings this morning . That gives us an excellent excuse to crack open the Calcbench databases and dine on Lilly’s disclosures about its blockbuster weight-loss drugs Zepbound and Mounjaro. As we’ve noted before in these pages, pharmaceutical firms disclose the sales of their individual blockbuster drugs. So we opened our Segments, Rollforwards & Breakouts page , called up Lilly’s ($LLY) quarterly revenues for Zepbound and Mounjaro, and then compared the sales of those two drugs against all Lilly’s other products.  The result is Figure 1, below. As you can see, Lilly’s two GLP-1 weight loss drugs went from 26.5 percent of total sales at the start of 2024 ($2.32 billion against $8.77 billion) to two-thirds of total sales today ($14.9 billion of $23 billion).  Figure 2, below, takes all that information and reframes it in dollar amounts. Again, the tale is...

The Bigger Picture of Blockbuster Drug Sales

Image
As regular readers of this blog know, from time to time Calcbench examines the revenues that pharmaceutical companies receive from their so-called “blockbuster” drugs — that is, the companies’ biggest-selling products, which typically are reported as individual operating segments. Today we wanted to examine a bigger issue: the total portfolio of blockbuster drugs that pharmaceutical companies manage, and how those individual revenue streams evolve over time. That is, a pharma company might depend for years on one blockbuster drug, but as that product approaches the end of patent protection or faces new competition from a rival, the pharma company will need to bring new blockbusters to market to succeed the old one.  To explore that question, we looked at individual drug sales at four large pharma companies — AbbVie, Johnson & Johnson, Merck, and Pfizer — from Q1 2020 to Q2 2025. The results are presented in four figures, below. First is AbbVie ($ABBV).  Next up is Johnso...

Exposure to Medicare Drug Negotiations

Image
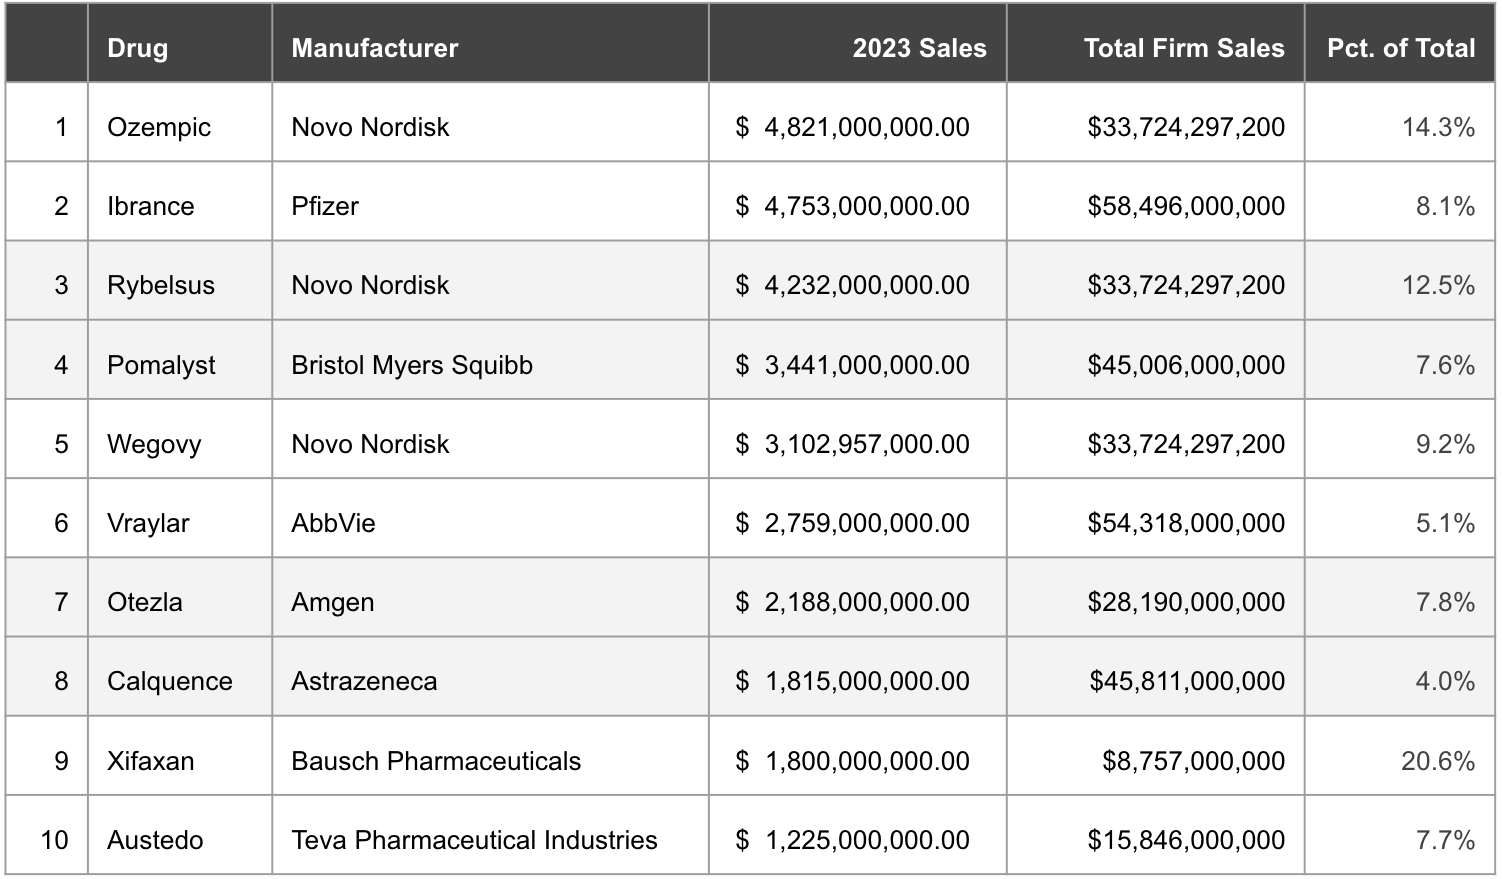
Today, the final working day of the Biden Administration, the Department of Health & Human Services announced that it had added 15 more drugs to its Medicare Drug Price Negotiation Program , to see how much the federal government can pressure pharmaceutical companies into lowering their prices.  Obvious question for financial analysts: which firms make these drugs, and how important are those products to the company’s total revenue?  Don’t worry — Calcbench figured it out for you! Pharmaceutical firms are required to report annual sales of their blockbuster drugs as individual operating segments of the whole business. So we just took the list of drugs newly added to the Medicare Negotiation program, identified who sells them, and then looked up each drug’s individual revenue. The result is Table 1, below. As you can see, some of the drugs are major revenue sources for their respective manufacture. Xifaxan, used to treat diarrhea, accounted for 20 percent of Bausch Cos. ’ ...

Charticle - Pharma Research Trends

Image
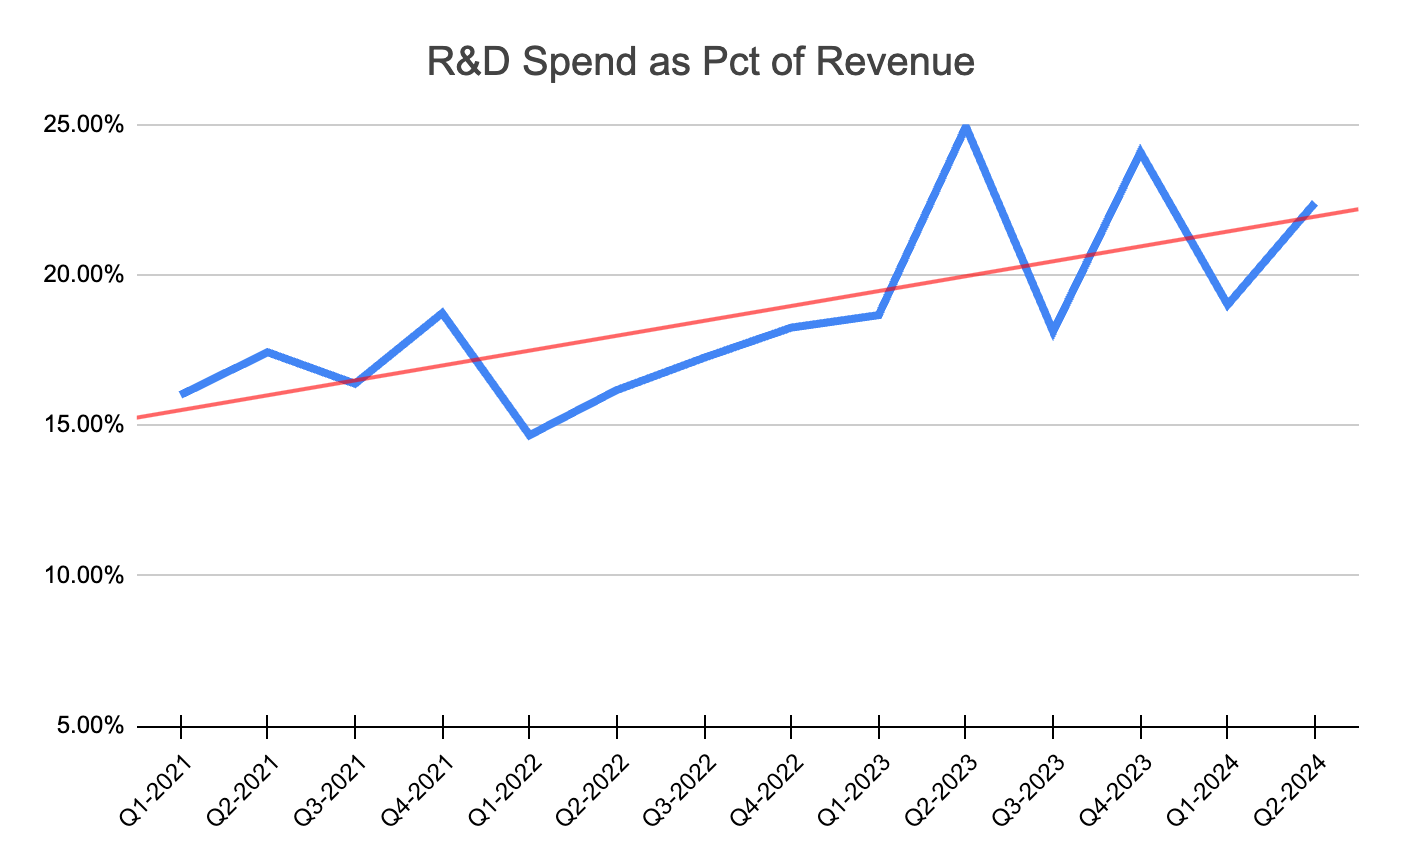
You may have noticed an item in the Wall Street Journal this week about Charles River Labs ($CRL) warning of a slowdown in demand from its customers. Since CRL sells research equipment and services to large pharmaceutical companies, that suggests that Big Pharma is slowing down its R&D spending. The crackerjack Calcbench research team then wondered: how accurate is that hypothesis? What data do we have that might suggest where things are going?  To answer those questions, Calcbench examined a group of roughly 120 pharmaceutical firms making at least $250 million in annual revenue, tracking their R&D spending as a percentage of revenue for the last 14 quarters. See Figure 1, below. The blue line is actual spending per quarter, and as you can see it has fluctuated from 15 to 25 percent since the start of 2021. The red line is the underlying trend, and that has been gliding up nicely, even though R&D spending levels have gyrated more wildly in the last year or so. But th...

Sample of Q2 2024 Pharma Drug Sales KPIs

Image
Here's a short summary of drug sales for 4 pharmaceutical companies from earnings reports in Q2 '24. Two of the firms reported this morning (July 30th) so the data is fresh.   Included in this small sample are Johnson & Johnson (ticker: JNJ), Pfizer (ticker: PFE), Abbvie (ticker: ABBV) and Merck (ticker: MRK). Using our Excel Add in and our Disclosures query tools, we are able to extract these segments in a flash.   A few noteworthy things.  Drugs that formed a significant portion of revenue in Q2 2024 are  Merck Keytruda (45%) and Gardasil (15%)   J&J  Stelara (13%) and Darzalex (13%)  AbbVie Humira (16%) Skyrizi (16%) Pfizer Elliquis (14%) Time Series of Revenues by Firm / Drug below