Posts

Showing posts with the label retail

Update: 133 firms and $20.3B in Tariff Refunds

Since our last update, we've added 28 companies to the list, though most of that reflects catching up on research into filings from July and early August rather than new activity. Companies that actually reported in the last week or so include American Eagle Outfitters ($179M), Academy Sports and Outdoors ($83.7M, via a Participation Agreement that pre-sold a portion of its claim to a third-party buyer), Caleres ($55.6M), Destination XL Group ($4.6M), J.Jill ($18.4M), Lovesac ($20.3M), ChargePoint Holdings ($6.1M), and Petco ($6.8M). The total has grown from $19.3 billion across 105 companies to approximately $20.3 billion across 133 companies. Companies with a quantified IEEPA tariff refund figure identified by Calcbench as of September 10, 2026, listed alphabetically. Total: approximately $20.3 billion. See the main analysis for methodology, sourcing, and the largest recoveries by dollar amount. Company Ticker Refund Amount ...
More Tips on Retail Sector Analysis

Image
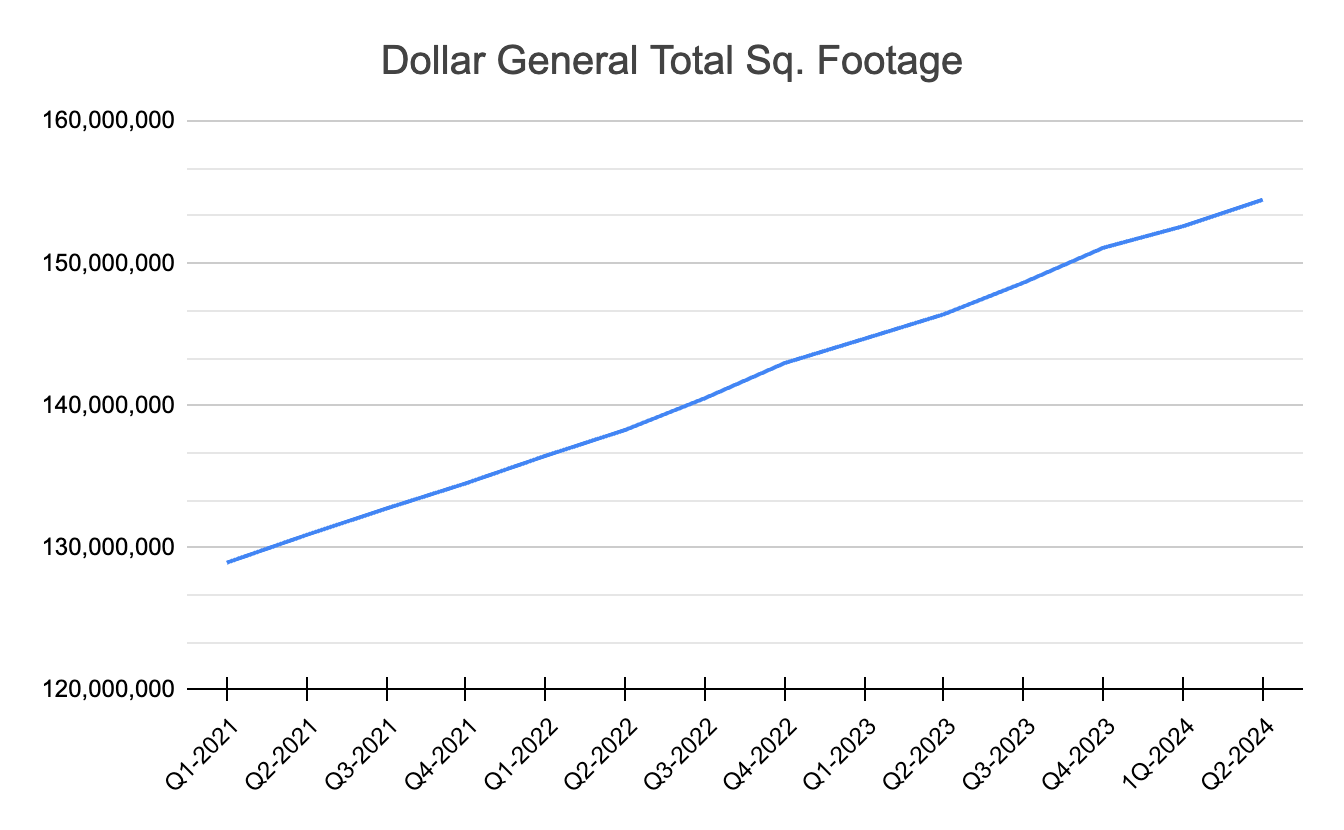
Today we continue our review of the retail sector disclosures (ahead of that sector’s Q3 earnings releases, which will arrive in the next few weeks) by examining the wide range of disclosures that retailers typically make in their earnings releases.  One good example comes from Dollar Genera l ($DG), the discount retail giant that made $38.7 billion in its fiscal 2023. Dollar General filed its second-quarter earnings release at the end of August, and included numerous nifty items: Same-store sales Merchandise inventories Category sales Store count Square footage You can track all these disclosures in the Footnote Query & Disclosure tool in Calcbench, seeing how they have evolved over time. For example, we used the Export History feature to dig up the total square footage of Dollar General stores for the last 14 quarters and put them into a chart. Figure 1, below, took us less than three minutes.  But wait, there’s more! We then dug up Dollar General’s quarterly revenue, ...

Getting Ready for Retail Sector Data

Image
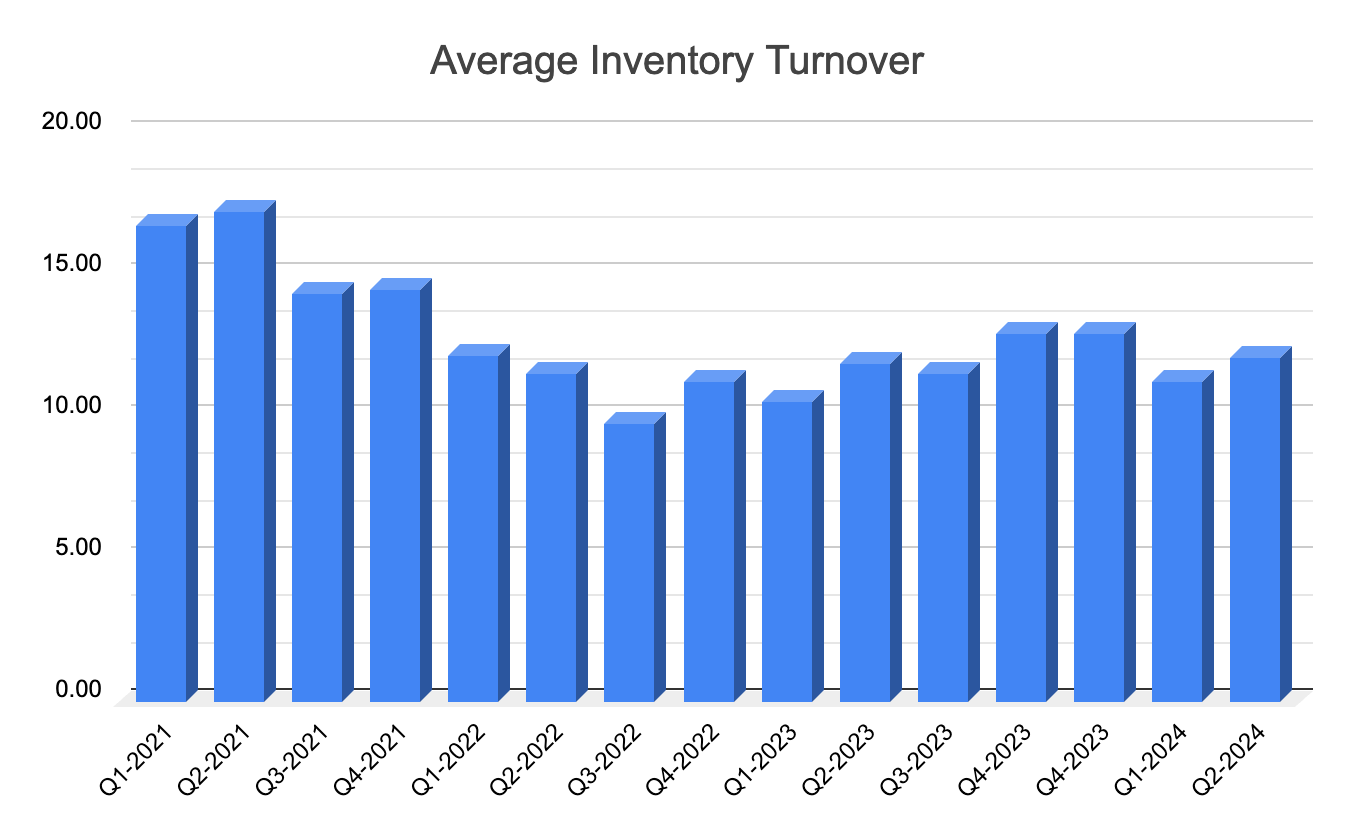
Most retailers won’t file their Q3 earnings reports for another few weeks yet, since businesses in that sector tend to have fiscal years that run one month behind the calendar quarter. To kill some time, then, let’s review the types of retail sector data you can track in Calcbench once those retailers do file. First example: the inventory turnover ratio , a crucial performance metric. Calcbench tracks that! The inventory turnover ratio measures how many times a company “turns over” (that is, sells and replenishes) its inventory in a given period. You calculate it by dividing the cost of goods sold into the average inventory for a given period. A higher number is considered good , since it typically means you’re selling goods at a brisk pace. (Although it can mean you’re not stockpiling enough inventory, too.)  But why bother with all that math yourself? Calcbench tracks inventory turnover from its Bulk Data Query page . Simply build the peer group of companies you want to research,...