Sit-Down Restaurants Go on Diet
Last month Calcbench had a post looking at major restaurant businesses and the number of locations they operate in North America. Today we have an update specifically on the number of sit-down restaurants in the North America market — because they showed a sharp decline in first-quarter 2025.
Figure 1, below, tells the tale. It charts total restaurant locations for two dozen restaurant businesses for the last eight quarters, grouped into fast-food (blue line) and sit-down (red line) categories. Note the precipitous plunge for sit-down restaurants in the first quarter of this year. (The number of sit-down locations is listed on the right-side axis.)
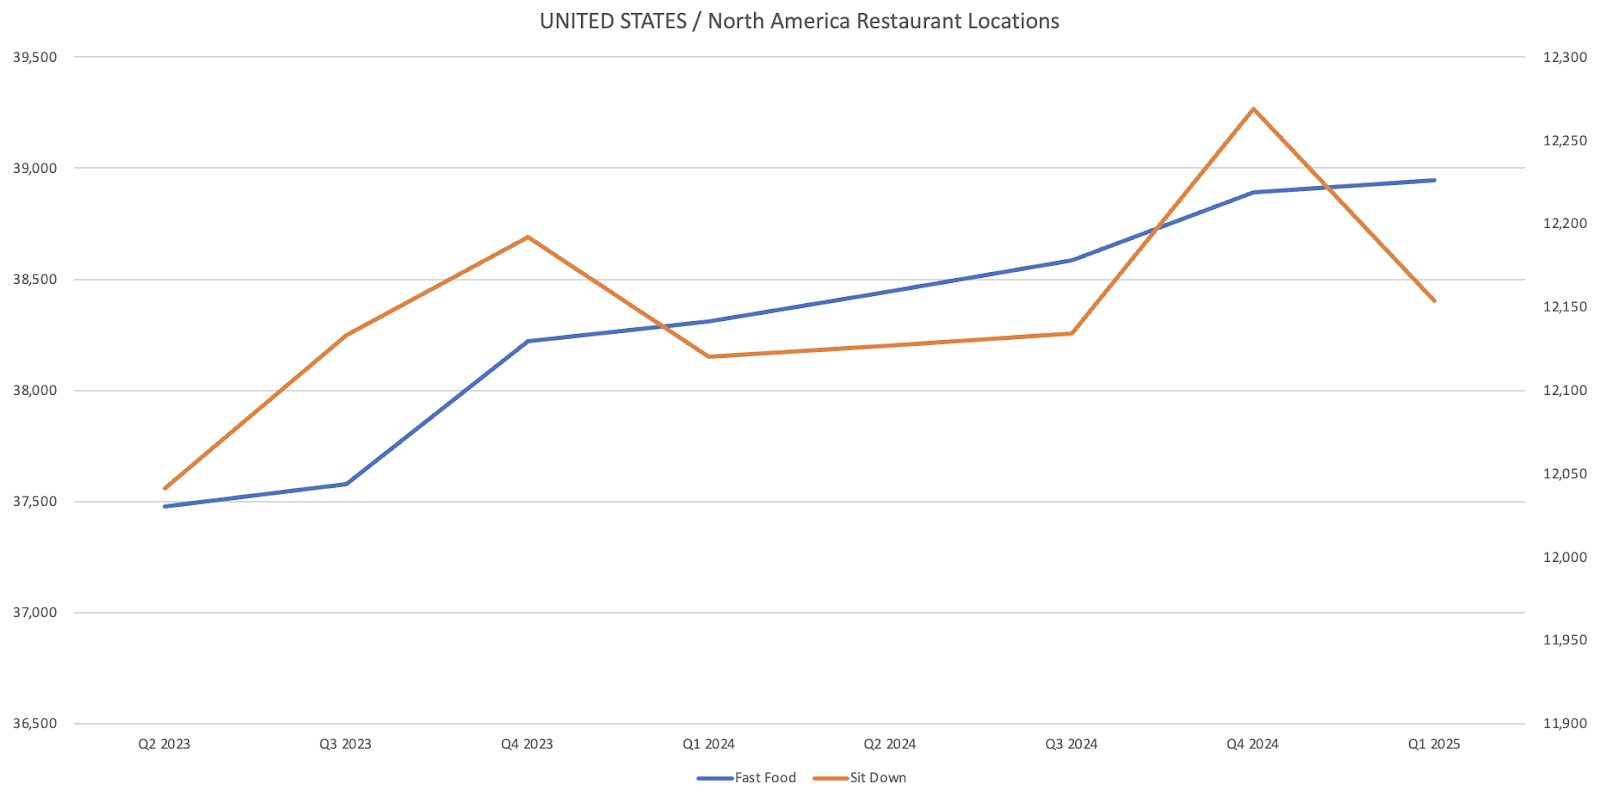
The restaurant companies in our sit-down category include Cava ($CAVA), Dave & Busters ($PLAY) and Darden Restaurants ($DRI), which operates the Olive Garden, Capital Grille; among others.
Long story short, the number of sit-down locations has see-sawed in a relatively narrow band for the last two years: from 12,041 in early 2023, to a peak of 12,269 at the end of 2024, and then a drop down to 12,154 in early 2025.
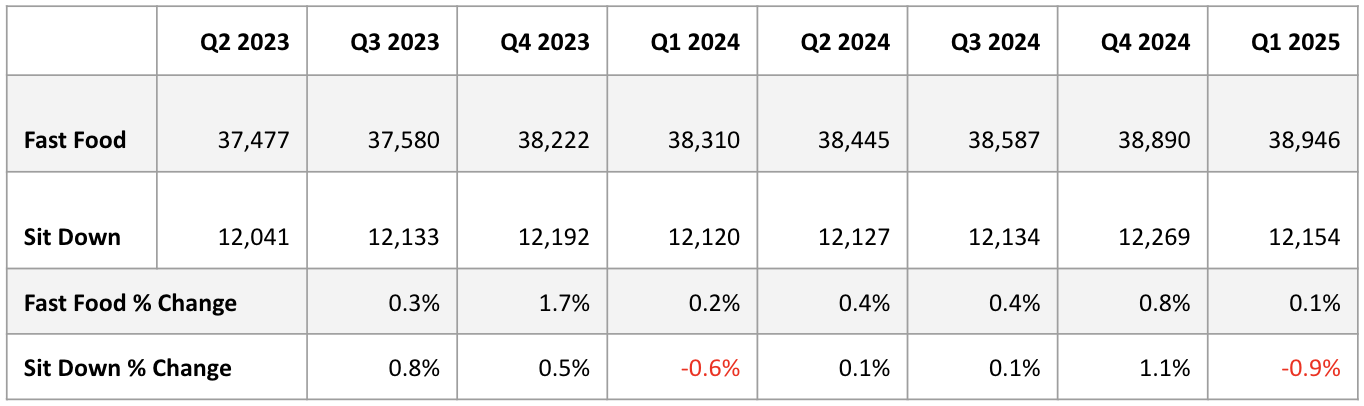
For those who don’t want to squint to see the numbers on the vertical axes, here is the same information displayed in a table.
The obvious question now is why sit-down restaurants had an appreciable decline in store locations at the start of this year. Perhaps the root cause is some cyclical rhythm of the restaurant world; maybe it’s driven by macro-economic factors such as greater economic uncertainty spooking people to save money by eating at home.
Calcbench is just the data supplier, so we don’t know — but we do have that data, readily available for subscribers to pull out and analyze. Then you can answer those questions more quickly, accurately, and easily.
To find this information yourself, just find the restaurant company you want to research, pull up its earnings release, and look for the data point on stores in operation (or stores opened and closed, which some firms also report). Then you can use our Earnings Model feature or our See Tag History feature to chart that data point through previous filings.
You can also chart store data for multiple companies at once. For example, you can use our Bulk Data Query page to dig up store closures for large groups; just scroll down to the “Footnote Points” section, where you’ll see a section that tracks data specific to retail businesses. Expand that and you’ll see the option to track number of stores.
If any readers out there have suggestions for other industry-specific research we should do, drop us a line at us@calcbench.com any time. We’re always happy to help a client dig into the data!

Comments
Post a Comment