Q4 Earnings Get a Bit Tighter
Our latest update from the Calcbench Earnings Tracker shows that Q4 earnings are still powering along — though not quite as nicely as they were last week.
This week’s analysis captures data from more than 1,000 non-financial firms that had filed Q4 earnings releases by 10 a.m. ET on Friday, Feb. 14. Net income continues to show double-digit growth from the year-ago period, but not quite as high as our numbers from last week. Total capex spending also fell, while cost of revenue and Sales, General & Administrative costs are now both higher than they were for Q4 2023.
Figure 1, below, tells the tale.
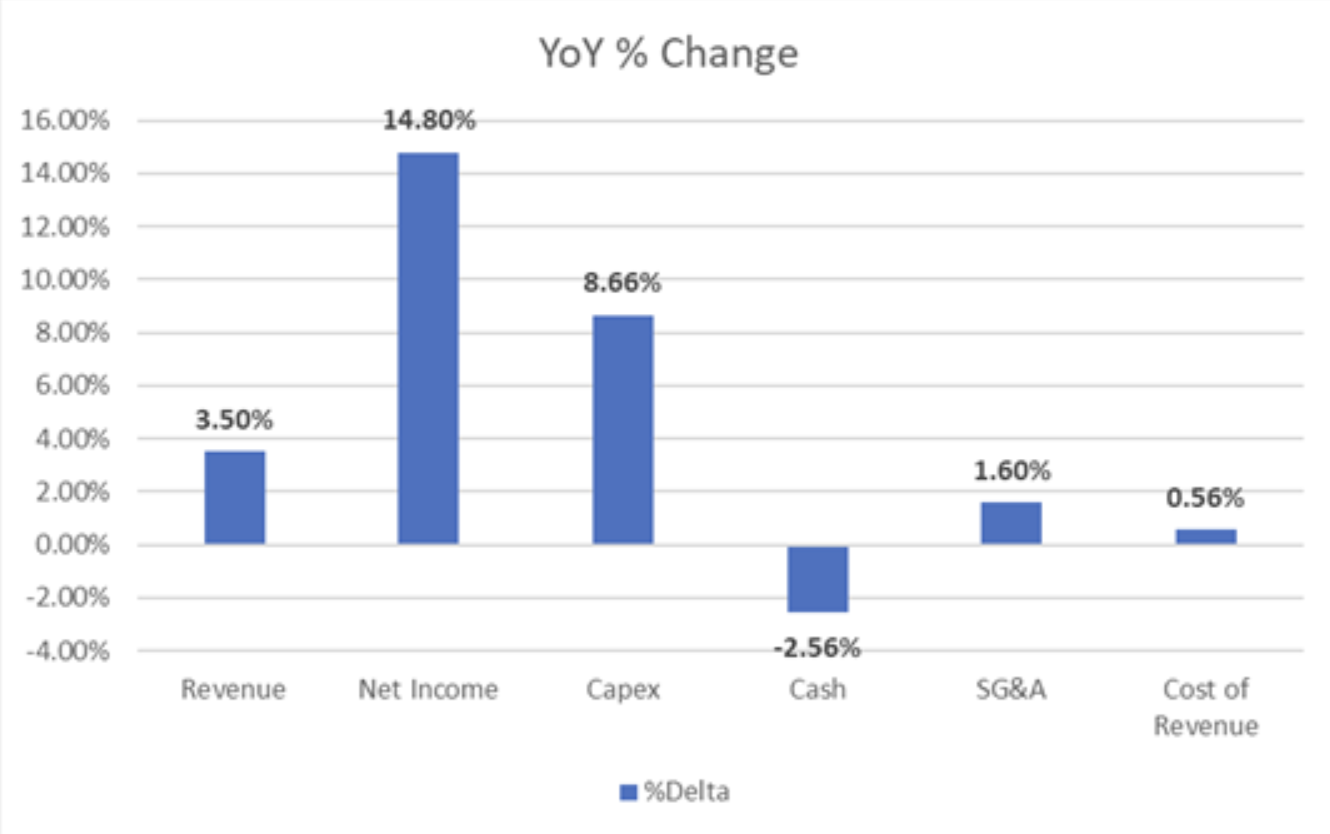
This is the first week we’ve seen cost of revenue and SG&A expenses now higher than they were in the year-ago period. Then again, our first two weeks of Q4 earnings analysis only tracked a relatively small number of large firms; this is the first week we’ve started to get data from a significant number of smaller firms.
So will this week’s shift to higher costs endure as even more filers submit data in the next few weeks? We shall see.
Calcbench tracks these earnings using our Earnings Tracker template, which pulls in financial disclosures as companies file their latest earnings releases with the Securities and Exchange Commission. The Earnings Tracker provides an up-to-the minute snapshot of financial performance compared to the year-earlier period.
We’ll continue to update our earnings tracker at the end of every week for the next few weeks, as quarterly reports flood into the database.
If Calcbench subscribers wish to get their hands on the template we use for this analysis, so you can conduct your own experiments at home, use this link to the file.
Please note that it will only work with an active Calcbench subscription. If you need an active subscription (and who doesn’t, really, when swift access to real-time data is so important?), contact us at info@calcbench.com.

Comments
Post a Comment