Posts

Showing posts from February, 2025

A Final Update on Q4 Earnings

Image
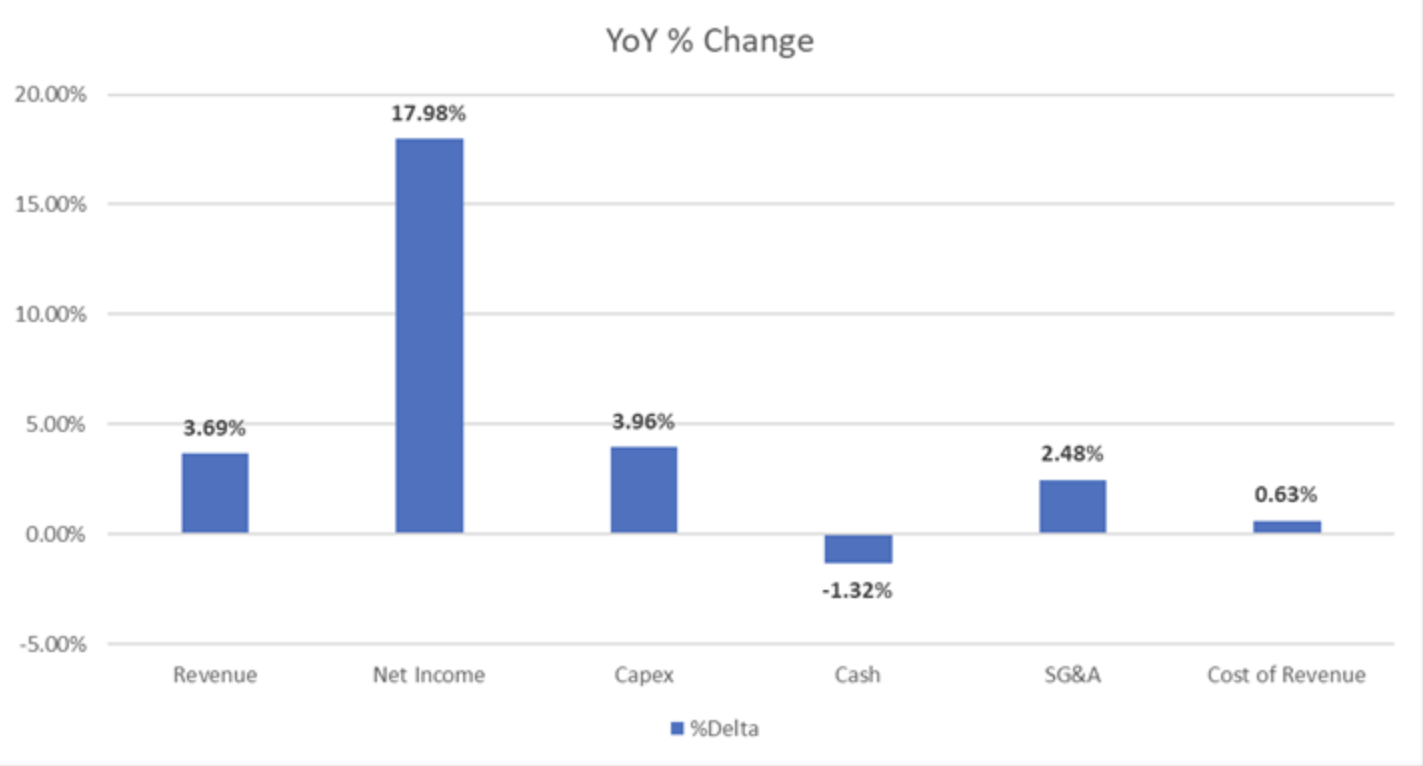
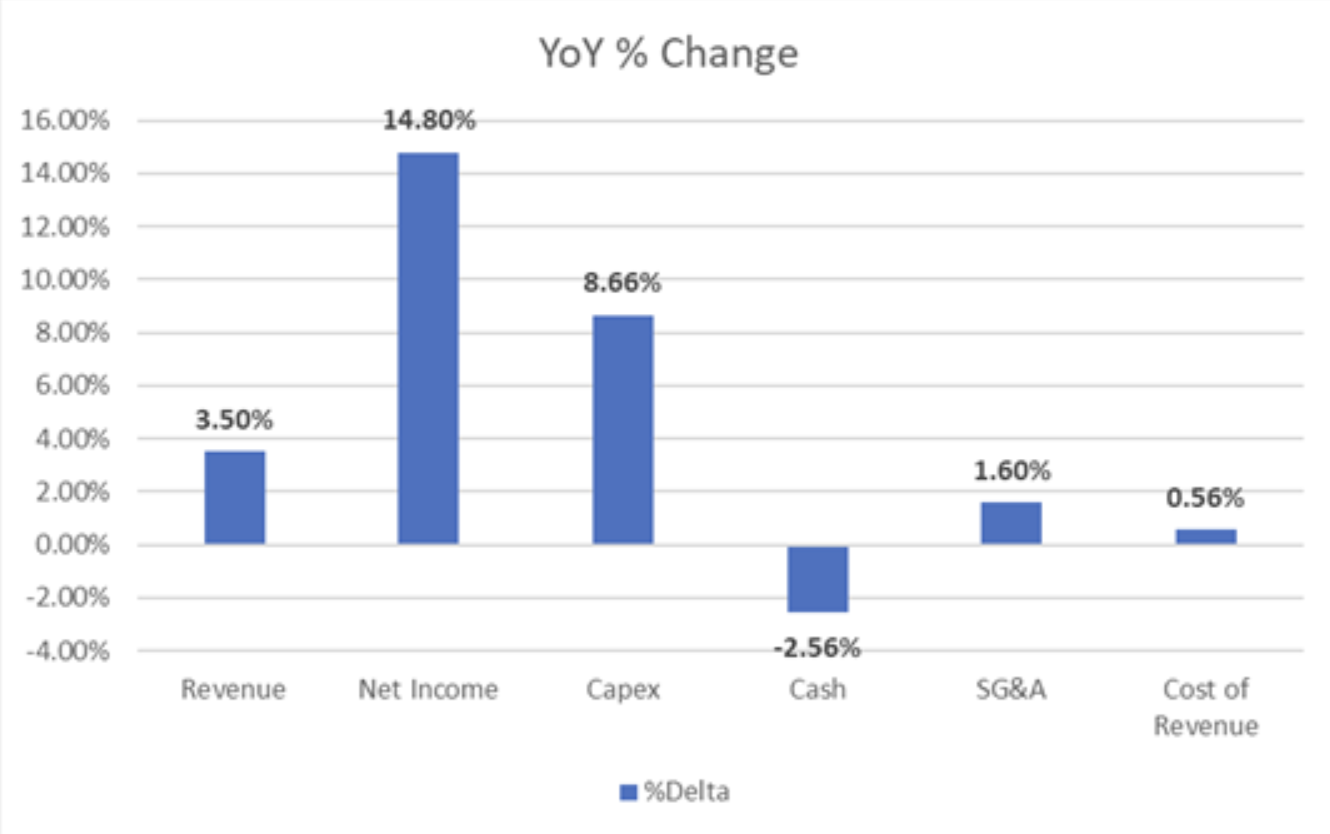
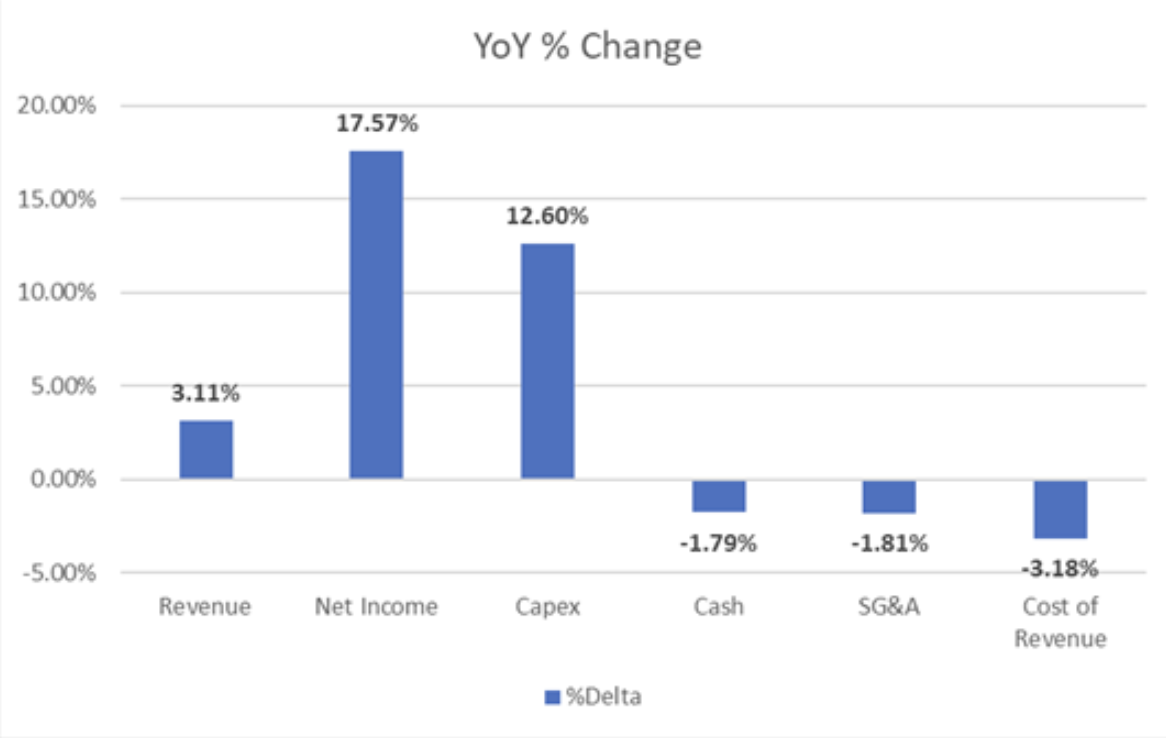
That’s it, folks — the Calcbench Earnings Tracker is calling time today on Q4 earnings, and the past week’s filers delivered a final pop to overall earnings compared to the year-ago period.  Our latest analysis captures data from more than 2,100 non-financial firms that had filed Q4 earnings releases by 3 p.m. ET on Friday, Feb. 28. Net income grew nearly 18 percent from the year-ago period, with revenue, capex spending, and Sales, General & Administrative costs all also a few points higher than they were for Q4 2023. Figure 1, below, gives our final numbers for the quarter. Some people might ask, “What about Nvidia? Didn’t they just report gobs and gobs of net income, and is that skewing net income growth for the whole?” That’s a fair question; NVidia ($NVDA) did report $9.8 billion in net income earlier this week, which is indeed an enormous sum.  Still, the answer is no, Nvidia’s performance did not skew results to any unusual degree. Even if you exclude the AI chipmak...

Non-Performing Assets are Rising--The Top 40 Most Exposed Banks?

Image
Recession? Growth? Don’t ask us. We at Calcbench can’t predict the future; what we can do is analyze real-time, accurate financial data, which helps us uncover trends that may not be noticed elsewhere. Today, we are looking at non-performing assets. As we posted yesterday , they are rising on a relative basis, and hit a three-year high at the end of 2024. It’s not a great look, yet as a percentage of overall assets, they remain low, at 0.5%.  But some banks have a lot more exposure than others. Today's research shows that if just  25% of nonperforming assets are ultimately charged off, the 40 banks listed below will see the largest (negative) impact on earnings.  For a deeper dive click here .  (Banks with negative EPS in 2024 in red)  

Charticle - Banks and Non-Performing Assets

Image
The banking sector is always worth close scrutiny, to ferret out possible signs of economic emphysema that might be lurking somewhere in the vast number of disclosures that banks make.  Exhibit A this week: non-performing assets as a percentage of total assets — which, while small in absolute dollar numbers, are rising rather swiftly in relative terms.  Figure 1, below, tells the tale. We pulled disclosures from the Q4 2024 earnings releases of 167 banks, and found that the percentage of non-performing assets was hovering at a three-year high at the end of last year. The good news is that non-performing assets are still only 0.5 percent of total assets, a tiny fraction. Then again, that number is up from a low of 0.2 percent at the end of 2022. This means that the relative percentage has more than doubled in two years, which is a steep increase. Of course, Figure 1 only depicts average numbers derived from a group of 167 banks. The numbers for individual banks might paint very...

Comparing Commerce at Walmart, Amazon

Image
Walmart ($WMT) made headlines this week with its latest quarterly report , which included news of strong earnings over the holiday season but spooked investors with warnings that growth in 2025 might be slower than first anticipated.   One number that caught our eye was Walmart’s quarterly revenue, which clocked in at $173.4 billion. That’s impressive, but it’s also a shade lower than quarterly revenue at rival retail giant Amazon.com ($AMZN), which reported $187.8 billion for its most recent quarter.  But wait! Is it really fair to compare Walmart and Amazon like that? After all, Amazon has a significant operating segment that has nothing to do with consumer commerce: Amazon Web Services, an IT hosting platform that Amazon sells as a service to other companies. Walmart doesn’t have a comparable line of business.  So if we want to compare the brick-and-mortar world of Walmart against the e-commerce world of Amazon, how can we do that?  Actually, in Calcbench ...

MicroStrategy Assumes Its Final (Bitcoin) Form

Image
Bitcoin holding company MicroStrategy ($MSTR) filed its 2024 annual report today , which gives us as reasonable an excuse as any to look at the former software company’s financial disclosures and see what happens when you transmogrify yourself into a bitcoin mainstay. For those who haven’t paid attention to MicroStrategy's journey until now (oh, how we envy you), once upon a time the company had been a developer of business analytics software. In 2020, however, CEO Michael Saylor boldly announced that from then forward, MicroStrategy’s main line of business would be buying and holding bitcoin. That August, the company dropped $248.9 million to buy 21,454 bitcoin. MicroStrategy has kept on that path ever since, issuing bonds and then using the cash to buy ever more bitcoin. Those holdings have also increased in value on a per BTC basis, including an astonishing price run that began immediately after the 2024 election and continues to this day. The result is Figure 1, below, which c...

Q4 Earnings Get a Bit Tighter

Image
Our latest update from the Calcbench Earnings Tracker shows that Q4 earnings are still powering along — though not quite as nicely as they were last week.  This week ’ s analysis captures data from more than 1,000 non-financial firms that had filed Q4 earnings releases by 10 a.m. ET on Friday, Feb. 14. Net income continues to show double-digit growth from the year-ago period, but not quite as high as our numbers from last week. Total capex spending also fell, while cost of revenue and Sales, General & Administrative costs are now both higher than they were for Q4 2023. Figure 1, below, tells the tale. This is the first week we’ve seen cost of revenue and SG&A expenses now higher than they were in the year-ago period. Then again, our first two weeks of Q4 earnings analysis only tracked a relatively small number of large firms; this is the first week we’ve started to get data from a significant number of smaller firms.  So will this week’s shift to higher costs endure a...

On Amazon and Server Lifespans

So there we were the other day, skimming the latest from Deep Quarry , a newsletter on financial statement analysis written by accounting aficionado Olga Usvyatsky.  She had been picking apart Amazon.com’s latest quarterly report , and noted that the e-commerce giant had revised the useful life of certain servers and networking equipment downward from six to five years. That change, Usvyatsky noted, will have the practical effect of reducing 2025 operating income by $700 million. Moreover, Amazon ($AMZN) also decided to retire some equipment early; that led to $920 million in accelerated depreciation in Q4 2024 and will reduce 2025 operating income by another $600 million. Wait a minute. The useful life of computer servers, why does that sound familiar…  Because Calcbench wrote about that exact issue in 2021!  Back then, we noted that Google ($GOOG) and Microsoft ($MSFT) had both extended the estimated life of their computer servers from three years to four, which had t...

List of Steel Producers who reported US Sales but are Non US

Image
Here's the entire table.  It's relatively small, and there is only one firm that looks to be potentially impacted based on our data set.  ArcelorMittal (ticker: MT).  This was quickly put together using the Calcbench segments and multi-company functions.    

Q4 Earnings Keep Powering Along

Image
Another week, another update on Q4 earnings from the Calcbench Earnings Tracker. Our latest analysis, of more than 700 companies, shows brisk growth in net income from the year-earlier period and a few other important metrics also moving in the right direction.  Calcbench tracks these earnings using our Earnings Tracker template , which pulls in financial disclosures as companies file their latest earnings releases with the Securities and Exchange Commission. The Earnings Tracker provides an up-to-the minute snapshot of financial performance compared to the year-earlier period. At close of business on Friday, Feb. 7, we had Q4 filings for more than 700 non-financial firms. Revenue was up 3.11 percent, but net income popped an impressive 17.6 percent compared to the end of 2023. See Figure 1, below. One nice data point is the cost of revenue, which is down 3.2 percent from the year-ago period. That tracks with our first Q4 earnings update last week, which reported a 3.94 percent dec...

Revenue Streams at the New York Times

Image
The New York Times ($NYT) filed its latest corporate earnings report on Wednesday, giving the Calcbench research time another chance to engage in one of our favorite pastimes: analysis of segment disclosures! Specifically, the NYT reports two revenue streams, subscription and advertising, for two separate customer categories: online and print customers. That lets us ask some interesting questions: How much is online revenue growing as a portion of total revenue?  Is online revenue growing fast enough to replace declining print revenue?  Is online revenue growing fast enough to keep revenue growing overall?  Using our Export Data Tables feature , we were able to answer those questions within a few minutes. We tracked subscription and advertising revenue for print customers, the same for online customers, added everything up — and that let us see how print and online revenue compared as portions of the total revenue mix. Figure 1, below, shows that online revenue is sur...