Microsoft, Oracle, and a Non-GAAP Thought Experiment
Our top priority at Calcbench is always to help financial analysts bring more rigor and clarity to your work. Today we want to give an example of how that can happen with a bit of analysis of our own, comparing the earnings of Microsoft ($MSFT) and Oracle ($ORCL).
We start with a quick comparison of the two tech giants’ earnings for 2024, which they both filed last summer. (That’s an important detail, we promise.) See Figure 1, below.
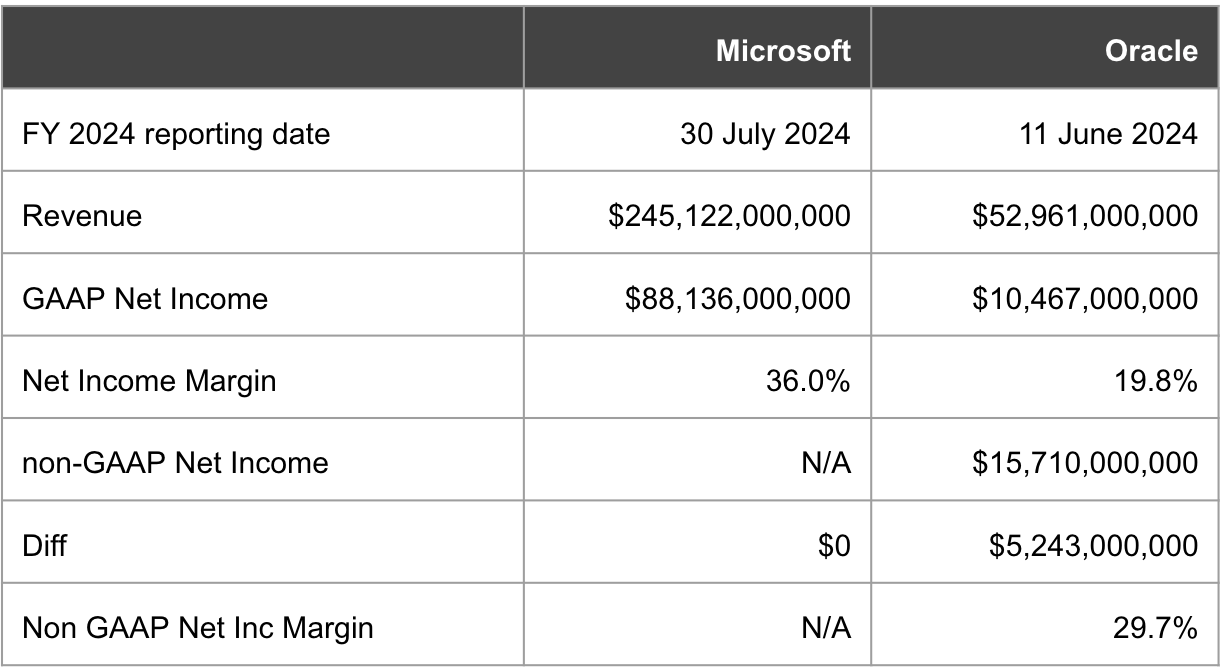
We can start by stating the obvious: Oracle reports adjusted, non-GAAP net income, while Microsoft doesn’t.
But what if Microsoft did report non-GAAP net income? Or more precisely, what if we could estimate Microsoft’s non-GAAP net income in comparison to Oracle?
Actually you can estimate the non-GAAP net income of Microsoft, because Microsoft does report all the same expenses as Oracle; it just doesn’t report them as non-GAAP adjustments. But finding those expenses and modeling out what Microsoft’s adjusted net income could be is a breeze.
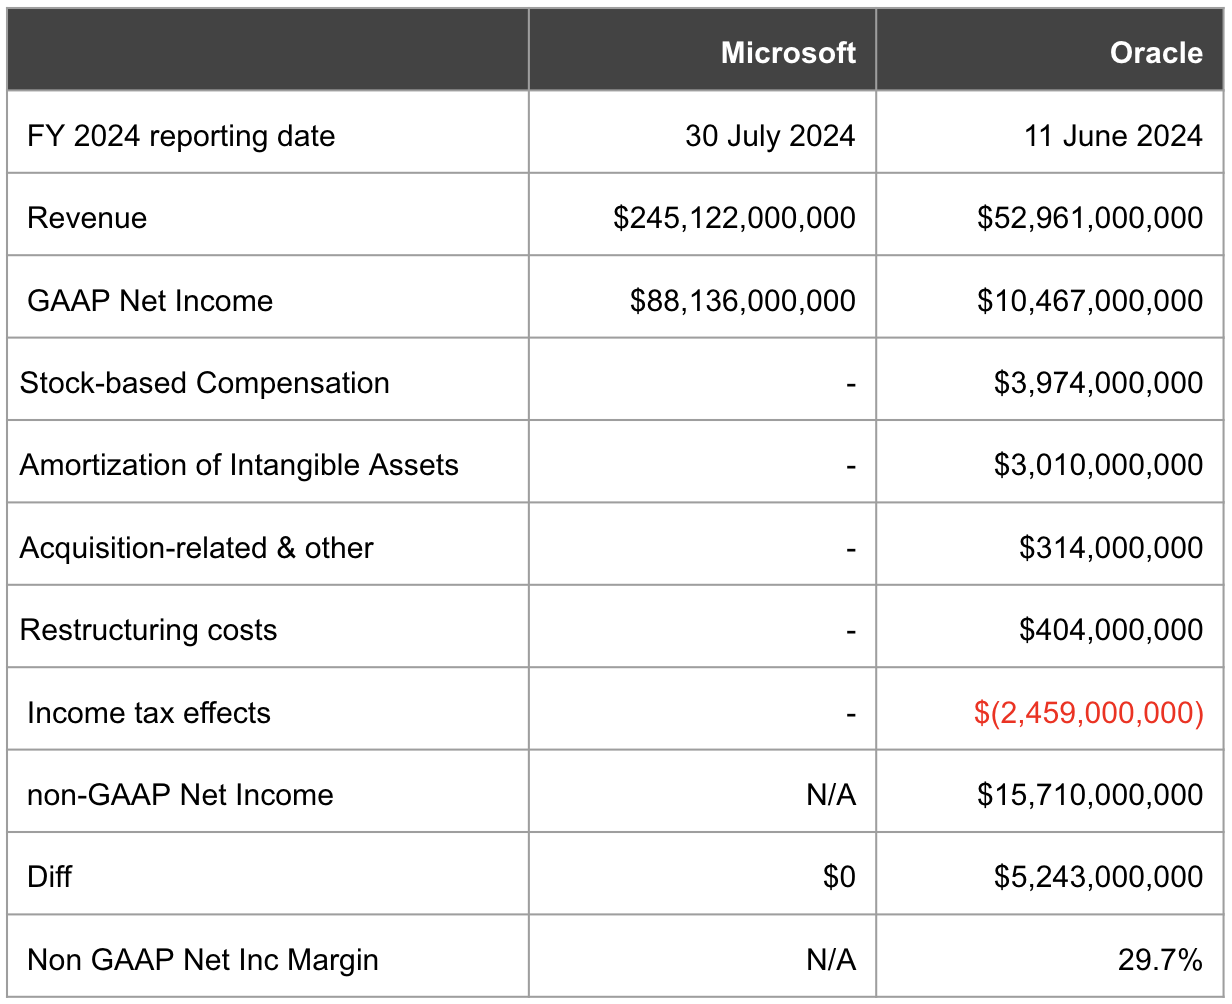
Figure 2, below, starts us on that journey. We added all of Oracle’s non-GAAP adjustments so you can see how the firm got from $10.47 billion in GAAP net income to $15.7 billion in adjusted net income. The adjustments themselves are all listed in Oracle’s earnings release for its fiscal 2024.
The next step is to find those same non-GAAP items for Microsoft — which isn’t hard to do, if you use Calcbench and know where to look.
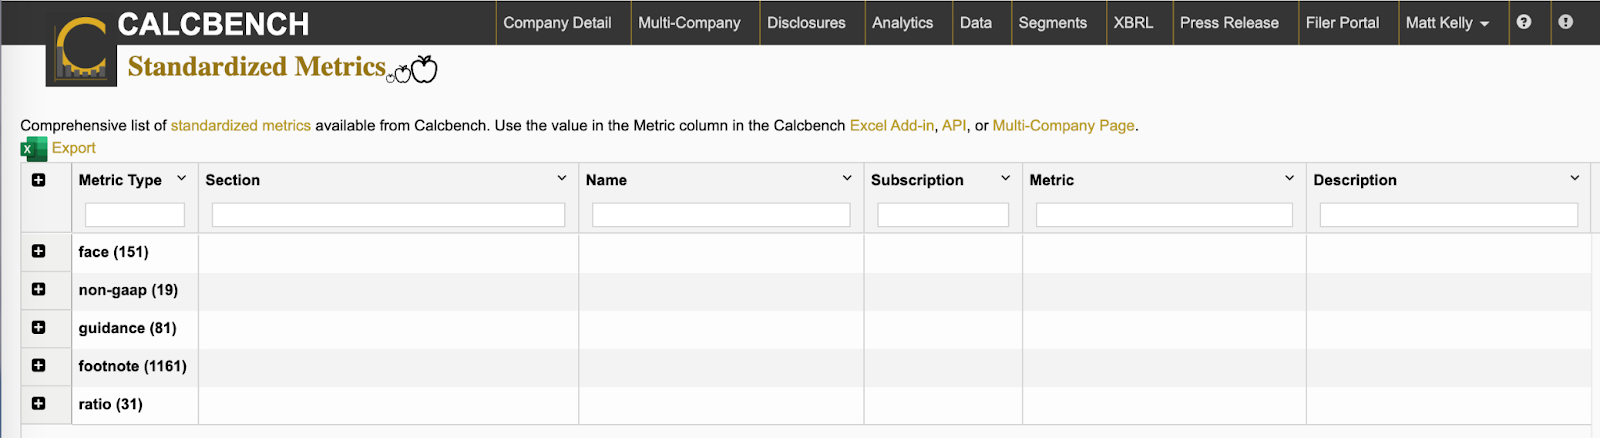
For example, you can find the costs of a company’s stock-based compensation on its statement of cash flows. You can find amortization of intangibles in the footnote disclosures, and tax effects as well. Just about any non-GAAP adjustment you see some companies make in the earnings release, that same item exists somewhere in the footnotes for all companies, even if a company decides not to report that item as a non-GAAP adjustment.
Running Some Non-GAAP Numbers
So we dug through Microsoft’s footnote disclosures, found two comparable non-GAAP items: stock-based compensation and amortization of intangibles. If you add those items back to Microsoft’s 2024 GAAP net income, you arrive at a hypothetical non-GAAP net income comparison that would look something like what we have in Figure 3, below.
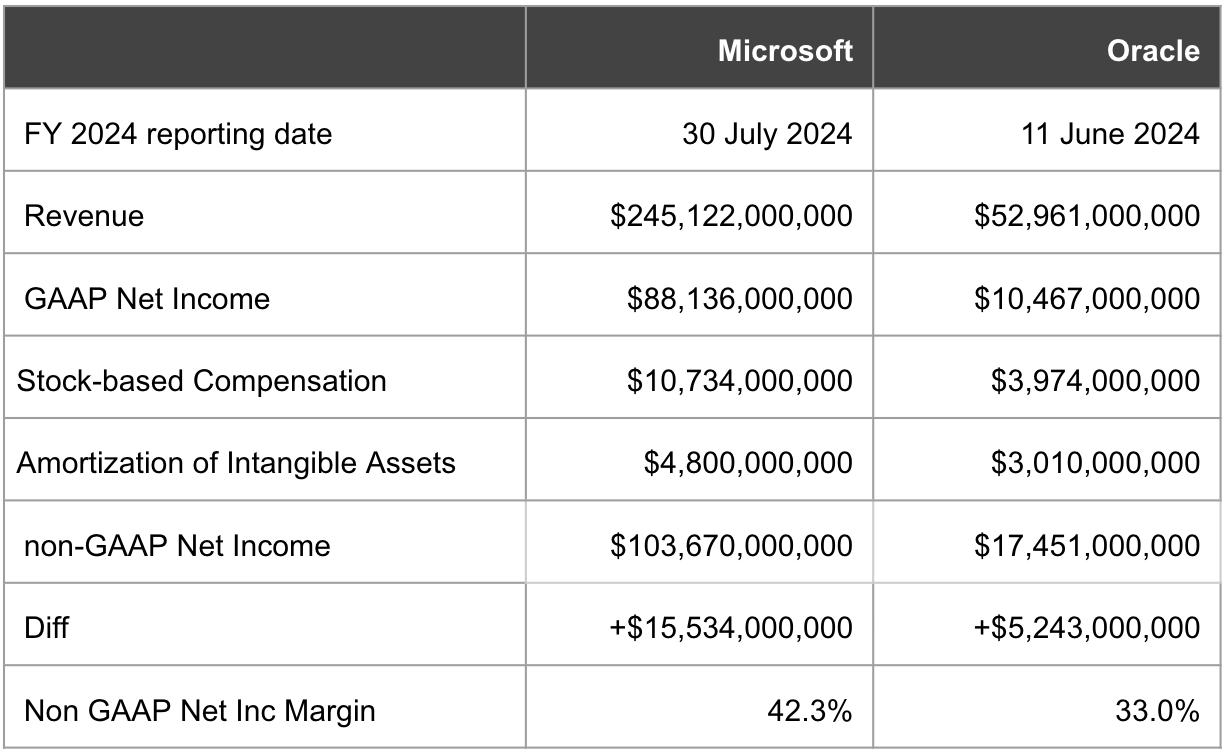
This comparison isn’t completely perfect. For example, you’ll notice that we struck a few of Oracle’s non-GAAP adjustments on restructuring, acquisitions, and tax costs (which weren’t easily discerned from Microsoft’s disclosures) so that we could maintain an apples-to-apples comparison. Then again, this is non-GAAP reporting; you’re allowed to do that, so long as your logic is clear and consistent.
Anyway, these calculations show us that Microsoft is more profitable whether we’re talking GAAP net income (see Figure 1, above) or the modified non-GAAP net income we just cooked up for Figure 3.
One point to note is that these are last year’s numbers. Oracle has already filed its fiscal 2025 financial results earlier in June, and Microsoft will file its next annual report in mid-July. What would the comparisons look like with fresh numbers? We don’t know, but we’ll mark our calendars to find out.
Meanwhile, it’s also worth noting that Oracle stock is up about 43.7 percent over the last year, while Microsoft is up only 7 percent. Does that square with the higher GAAP and modified non-GAAP margins we calculated above? You tell us.

Comments
Post a Comment