Charting Deferred Revenue, Backlog at Cisco
Networking equipment giant Cisco Systems ($CSCO) filed its latest earnings release last week. That release includes data on deferred revenue and remaining performance obligations (an indicator of expected future revenue), so let’s dig into those numbers, shall we?
Tracking data on deferred revenue and remaining performance obligations (RPO) is useful because taken together, they help analysts understand the possibilities for a company’s future revenues.
Deferred revenue is money the company has already received from customers for goods or services the company hasn’t yet rendered. It’s listed as a liability until the company does deliver the goods, at which point the revenue converts to cash that can be listed as an asset.
Remaining performance obligation is revenue that a company expects to collect in future periods based on the company’s current contracts. So if a company has high “RPO” today, that implies it will have high revenue in the future.
As a bonus, you can also calculate a company’s order backlog by subtracting deferred revenue from RPO.
Different companies report the three above numbers in different ways. For example, some companies report deferred revenue and backlog, and from those two numbers you can calculate RPO. Other companies (such as Cisco) report deferred revenue and RPO, from which you can calculate backlog.
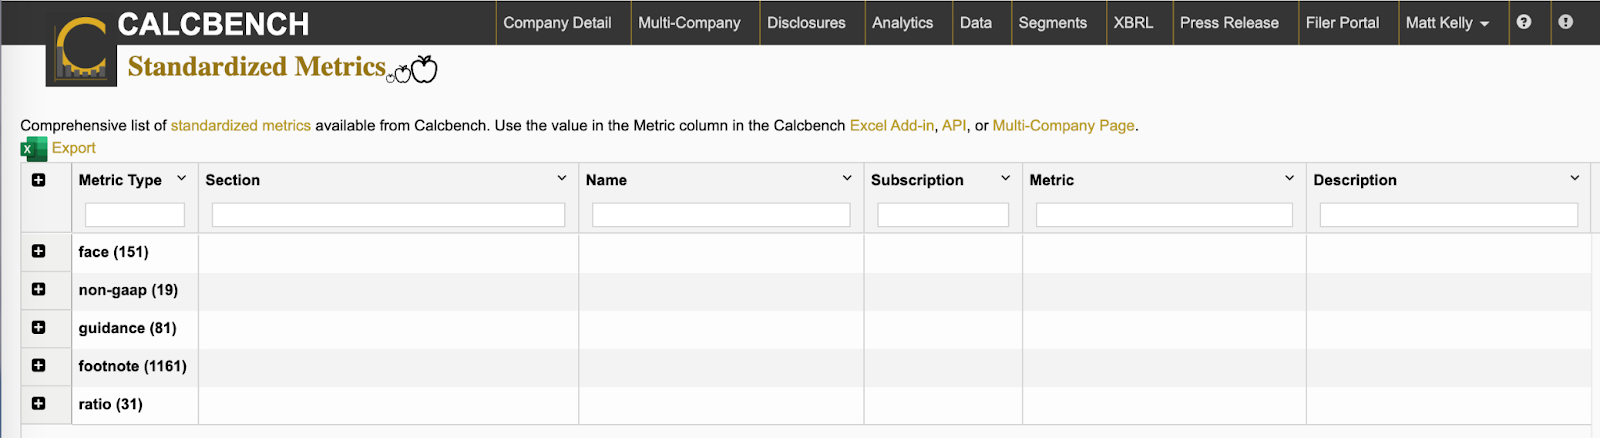
You’ll just about always find at least two of the above disclosures, and from those two you can calculate the third — but why waste precious time hunting around the earnings release to see which disclosures you have and what math you’ll still need to do? Calcbench can simplify all that work for you.
For example, we found the deferred revenue disclosure ($27.99 billion) on Page 9 of Cisco’s earnings statement. We hovered our cursor over that number for a moment until the “Export Tag History” option appeared, and we immediately saw all prior disclosures for that line-item right on our screen. See Figure 1, below.

We dumped that data into an Excel file, and then did the same for RPO, which was reported on Page 9 ($41.67 billion for the quarter).
Once we had those two columns of data in Excel, it was a simple matter of math to calculate order backlog (RPO minus deferred revenue), and convert all of that into a single chart.
That’s how we arrived at Figure 2, below — which shows quarterly numbers for all three metrics going back to the start of 2020.

This entire exercise — from “Oooh, Cisco just filed!” to Figure 2, above — took us about five minutes. You can use Calcbench to do the same for pretty much any other company you follow, too.
Better, Forward-Looking Analysis
We like this exercise with Cisco’s revenue disclosures because it demonstrates how analysts can get a better sense of a company’s potential future performance. (Calcbench explored this more deeply in a previous blog post about remaining performance obligations.)
Nothing is certain, of course — but if you look at the right historical data, it can help you understand deeper trends in the company’s business. Then you can draw better conclusions about what those trends mean for the future.

Comments
Post a Comment