Posts

Showing posts from May, 2025

Last Call on Q1 Earnings Data

Image
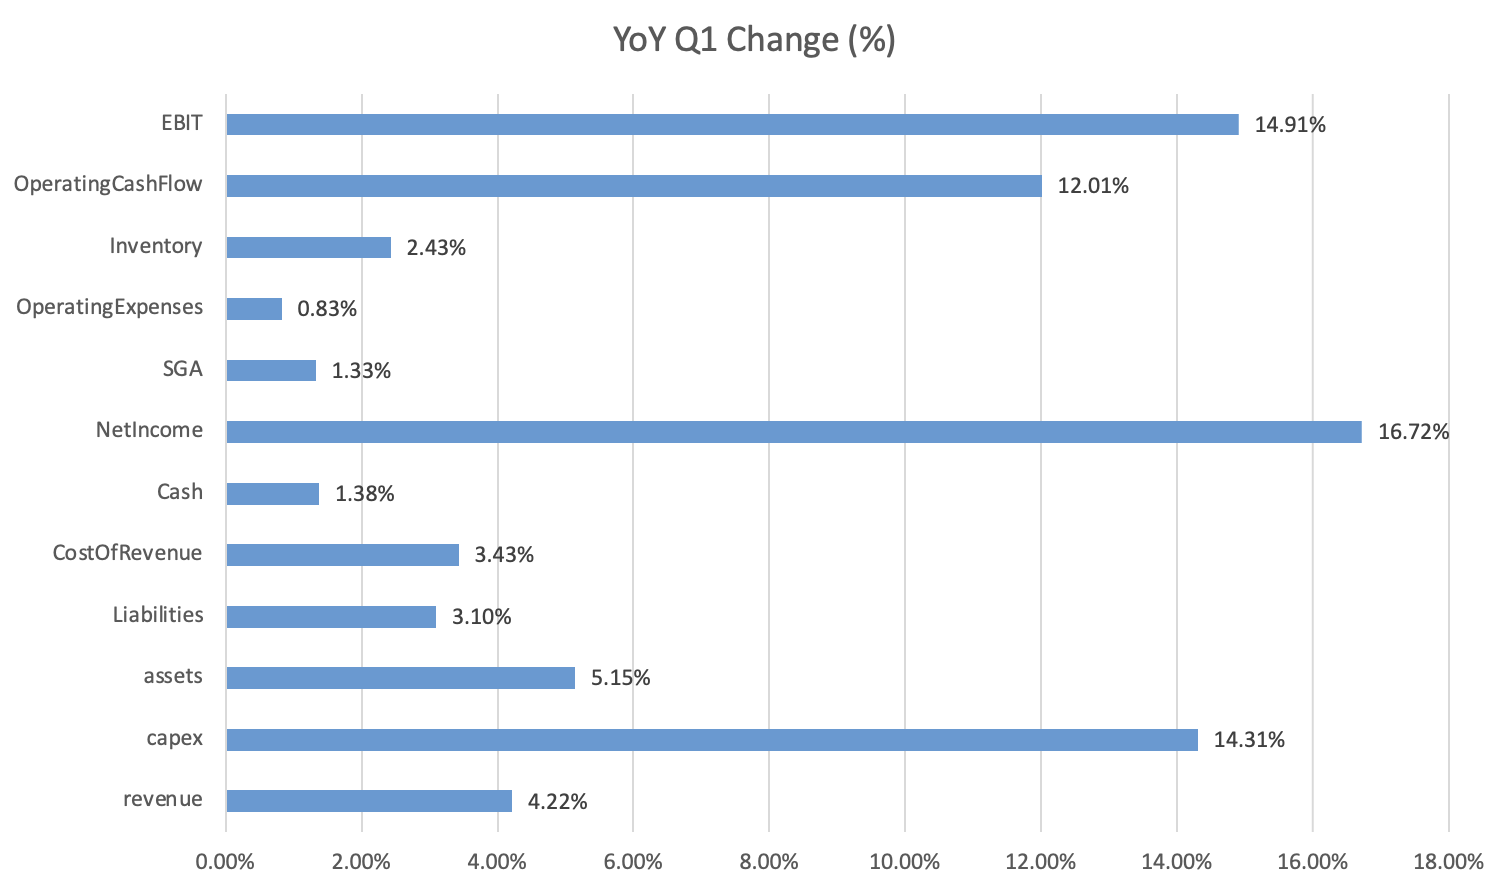
Today we offer one last look at earnings data for first-quarter 2025 filings — and now, with roughly 3,400 non-financial firms in our sample group, the numbers overall look reasonable. See Figure 1, below. Net income, revenue, operating cash flow, capital expenditures, and assets were all up for Q1 2025 compared to the year-ago period. Indeed, none of the 12 major financial metrics the Calcbench Earnings Tracker follows were negative for the quarter. Can’t complain about that.  The one point we’ve been following is the relatively close gap between revenue, up 4.2 percent from last year, and cost of revenue, up 3.4 percent. That spread is slightly wider than our previous look at earnings a few weeks ago , but it’s still not terribly wide. If tariffs or other pressures push cost of revenue up even further, that could drive companies to raise prices on their finished goods and re-ignite inflation. Meanwhile, cash is up 1.4 percent from the year-ago period. That’s a wider margin than ...

Counting Restaurant Openings

Image
Restaurants are a big business in North America — and Calcbench can help you understand just how big, by tracking the total number of restaurants that publicly traded food businesses are opening or closing from one quarter to the next. Publicly traded restaurant companies do report their total number of restaurants each quarter in their earnings releases. This means Calcbench can collect and crunch those numbers with just a few keystrokes, which is what we did one afternoon after rolling ourselves back to the office from a calorie-laden lunch. Figure 1, below, charts total restaurant locations for two dozen restaurant businesses for the last eight quarters, grouped into fast-food (blue line) and sit-down (red line) categories.  For those who can’t squint enough to see the numbers on the vertical axes, here is the same information displayed in a table. (As you can see, we are still waiting for enough Q1 data from the sit-down restaurants to add that component to the chart and table....

Digging Into Urban Outfitters Segment Disclosures

Image
Retail clothing operator Urban Outfitters ($URBN) filed its latest quarterly earnings release last week . This gives us an excellent opportunity to look at the brand- and channel-level disclosures that Urban makes, and how Calcbench can help you find and study those numbers.  For those financial analysts not among the fashion-forward (which includes all the men on the Calcbench team), Urban Outfitters operates under five separate brands: Its namesake Urban Outfitters, selling to both men and women; Anthropologie, selling primarily to women; Free People, selling to a younger female demographic; Nuuly, a rent-to-wear subscription service; Menus and Venues, a small restaurant and catering business.  The important point for financial analysts is that Urban Outfitters reports quarterly sales by each brand. So when we saw Urban’s latest report on our Recent Filings page, we used the Calcbench Earnings Model feature to view those brand-level revenue numbers at a quick glance. See F...

Charting Deferred Revenue, Backlog at Cisco

Image
Networking equipment giant Cisco Systems ($CSCO) filed its latest earnings release last week. That release includes data on deferred revenue and remaining performance obligations (an indicator of expected future revenue), so let’s dig into those numbers, shall we?  Tracking data on deferred revenue and remaining performance obligations (RPO) is useful because taken together, they help analysts understand the possibilities for a company’s future revenues.  Deferred revenue is money the company has already received from customers for goods or services the company hasn’t yet rendered. It’s listed as a liability until the company does deliver the goods, at which point the revenue converts to cash that can be listed as an asset. Remaining performance obligation is revenue that a company expects to collect in future periods based on the company’s current contracts. So if a company has high “RPO” today, that implies it will have high revenue in the future.  As a bonus, you c...

Q1 Earnings Still Looking Fair

Image
Another week, another burst of earnings analysis from the famed Calcbench Earnings Tracker. We now have Q1 2025 earnings data from more than 3,400 non-financial firms — and taken altogether, it’s hard to find fault with most of the big picture. See Figure 1, below. Net income, revenue, operating cash flow, capital expenditures, and assets were all up for Q1 2025 compared to the year-ago period; can’t complain about that.  Now onto the less pleasant stuff. First, cash is a mere 0.6 percent higher this quarter than one year ago. That’s not welcome right now, with recession fears circling like seagulls at the beach. Cash is always important in a recession.  Second, notice that companies’ cost of revenue is up 4 percent — not so far behind overall revenue, up 4.7 percent. This is the second week running that we’ve seen cost of revenue within spitting distance of revenue. If tariffs or other pressures push cost of revenue up even further, that could drive companies to raise prices ...