Posts

Showing posts from April, 2024

First Look at Q1 Earnings

Image
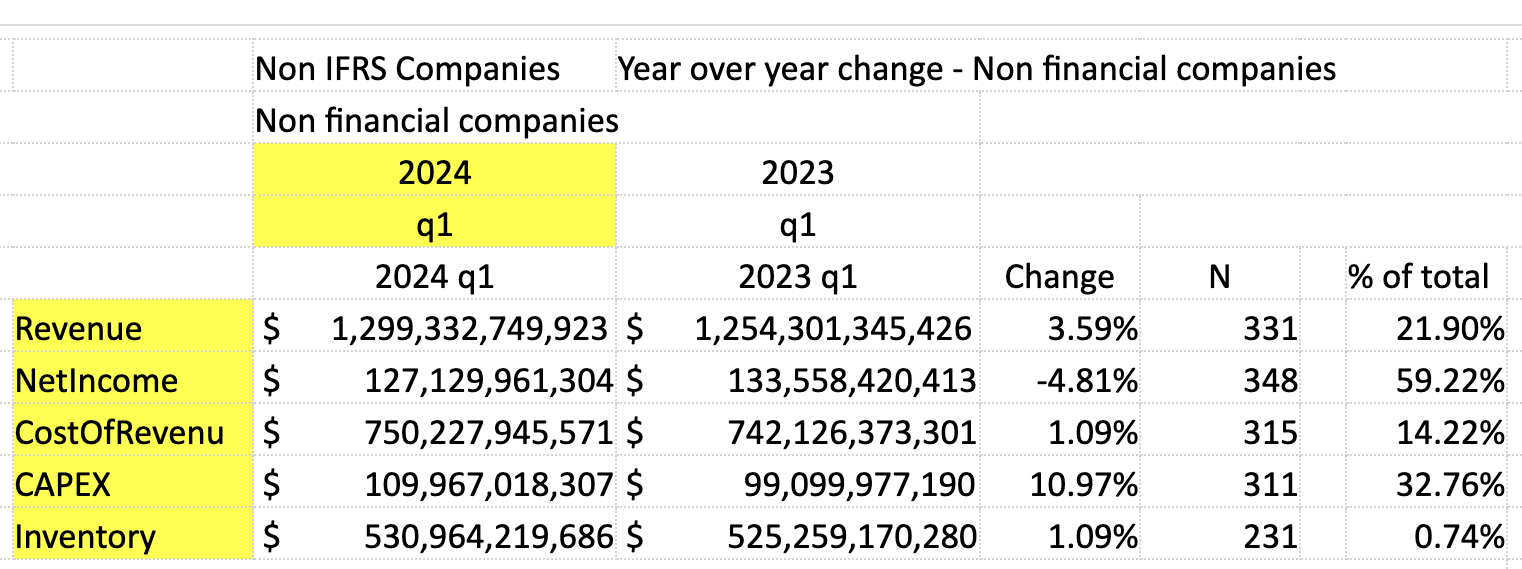
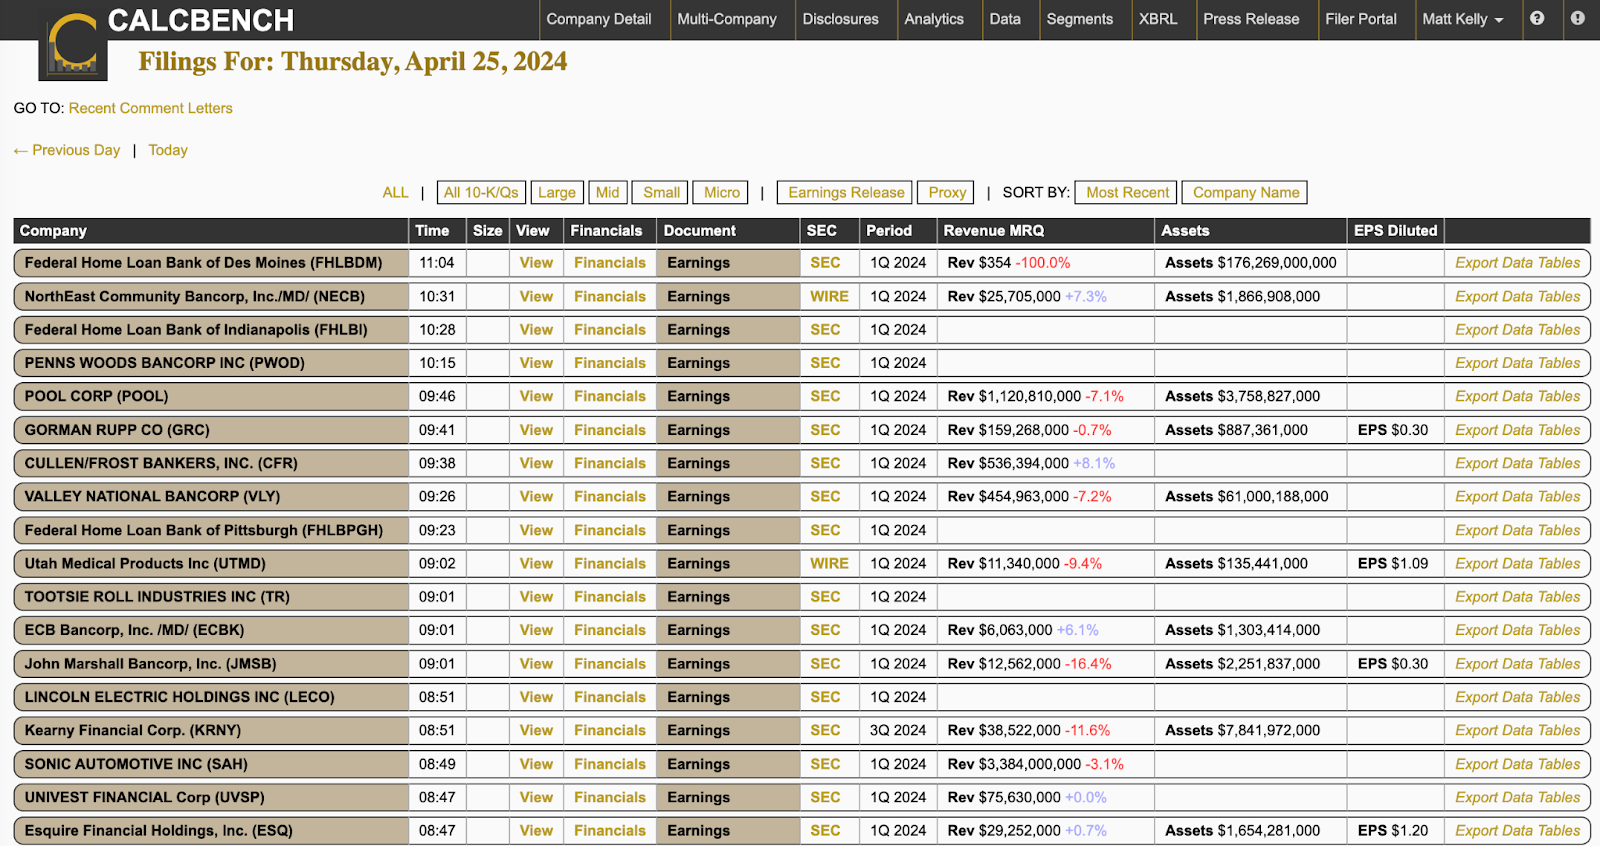
All right, financial analysts everywhere — the Calcbench Earnings Tracker is back in the house, with our first look at earnings for Q1 2024! We track these earnings using our Earnings Tracker template, which pulls in financial disclosures as companies file their latest earnings releases with the Securities and Exchange Commission. The Earnings Tracker provides an up-to-the minute snapshot of financial performance compared to the year-earlier period. Today is our first look at first-quarter numbers. As of 3 pm ET this afternoon, we had data for roughly 350 non-financial companies. The headline numbers are in Figure 1, below. As you can see, revenue is up 3.6 percent compared to the start of 2023, although net income is down 4.8 percent. There’s no cause for alarm about that net income number yet; by the end of earnings season in a few weeks’ time all these numbers might look quite different.  We also track cost of revenue to get a read on where inflation is going these days. So far ...

How to Research Earnings News

Image
Since earnings season for Q1 2024 is now in full swing, today we offer a refresher course on how to use Calcbench and our many database resources to analyze corporate earnings. The task is a bit more tricky than you think. For starters, let’s review a few fundamentals about earnings releases: Not every company issues an earnings release. Most do, because that helps investors; but earnings releases are not required by law, and some companies choose not to issue them. The format of earnings releases can vary from one company to the next. Again, most companies tend to report a few clearly defined fundamentals — revenue, net earnings, gross profit, and the like — but they don’t have to follow the rigid format that you’d see in, say, a 10-K filing.  Earnings releases can also contain lots of other information, such as operating metrics or key performance indicators. We’ve seen airlines report miles flows, ride-share apps report number of passengers booked, and railroads report number of...

Procter and Gamble Earnings Snapshot

Image
Consumer products giant Procter & Gamble ($PG) filed its first-quarter earnings report on Friday , giving us another chance to dive into the footnote disclosures and see whether we can intuit any warning signs about the larger economy. Total revenue for the quarter stayed essentially flat, rising a mere 0.63 percent to $20.19 billion. Thanks to Calcbench’s Export Table History feature, however, we were also able to extract revenue numbers for each of P&G’s six operating segments and compare Q1 2024 to the year-earlier period. See Figure 1, below. So that flatless was across virtually all segments except for fabric and home care, which rose 2.18 percent. That’s a lot of Tide and Febreeze people are buying. OK, so revenue is up; what about earnings? Total net earnings went from $3.42 billion one year ago to $3.78 billion this quarter, a jump of 10.4 percent. Figure 2, below, shows the same segment breakdown for net earnings.  Hmmm. Three of P&G’s five segments saw net ear...

Standardized Geographic Segments

 Calcbench now has standardized geographic segments.  Companies report the financial performance of geographic segments in their segment disclosure.  Unfortunately, because of differences in segments company report and lack of standardization in how segments are reported in XBRL  working with the geographic segment data is difficult. Calcbench makes an effort to map reported geographic segments to ISO 3166 countries or one of a finite set of regions. The below sheet, downloaded from Calcbench demonstrates.  The Segment column is the segment as reported by the filer, the Standardized Geographic Segment is the segment as standardized by Calcbench. The data is also available through the Calcbench API , see the a demonstration notebook .

Q1 Earnings Season Revs Up

Image
First-quarter earnings have begun to arrive — and as always, Calcbench is on the scene with the latest data to help you with your financial analysis! Let’s begin with a look at the Wall Street banks. Figure 1, below, shows interest expense for six of the largest players on Wall Street, including Morgan Stanley ($MS) which filed its Q1 2024 earnings release just this morning .  Altogether, interest expense for the six banks cited above rose a whopping 63.3 percent, from $74.25 billion in first-quarter 2023 to $121.25 billion in first-quarter 2024.  Clearly the one paying the most on interest is Wells Fargo ($WFC). Its interest expense soared 279 percent, enough that if an emoji with vertigo existed, we’d include that here.  Meanwhile, the six banks have a more varied picture on net interest income, as seen in Figure 2, below.  Notice that Citigroup ($C) soared past all others here; its net interest income popped 171.4 percent from the year-earlier period. And yes, ...

Q and A With Professor Lisa Koonce, UT Austin

Below is our latest conversation with accounting professors about how they use Calcbench in the classroom. We caught up with Lisa Koonce, Deloitte Chair in Accounting, McCombs School of Business, at the University of Texas at Austin. How did you first get introduced to Calcbench? How did it catch on at the McCombs School of Business?  I first heard of Calcbench at a conference. Specifically, I saw a presentation at the  American Accounting Association annual meeting several years ago, and a  professor at another school was talking about teaching data analytics. Afterwards I asked him how the students get their data. The answer was Calcbench. I then signed up for a demo.  Given that it was late in the academic year when I recommended that my school use Calcbench, another professor and I pooled our discretionary funds to purchase a subscription. The platform caught on, especially with those who teach Financial Statement Analysis. Soon thereafter, our department decided...

How to Research Non-GAAP Disclosures

Image
Non-GAAP financial disclosures and other performance metrics are now widely used in financial statements. So today we offer a refresher course to Calcbench users on how to find such data quickly and easily, and export it to Excel for your own further analysis. This may take a while because, of course, we have so many ways to capture and analyze non-GAAP data. Standardized Non-GAAP Metrics The easiest place to begin your research is on the Multi-Company Disclosures page . The field for standardized disclosure metrics that we track (on the left side of the screen) now tracks more than a dozen common non-GAAP disclosures. Figure 1, below, shows some of the potential choices when you type “non-GAAP” into the search field. Simply select the non-GAAP disclosure you want to find, and our database will pull it up for all companies in your peer group that report that metric. For example, Figure 2, below, shows all the net income and non-GAAP net income reported in the Dow Jones Industrial Avera...

Repercussions of R and D Tax Policy

Image
We always love to see how financial analysts put Calcbench data to work, so today we wanted to share a fascinating research note from Morgan Stanley that used Calcbench data to model the potential upside to some tax legislation working its way through Congress. The legislation in question, the Tax Relief for American Families & Workers Act, would revive several expired business tax breaks — and would delay the effective date of previous tax legislation that required companies to amortize R&D tax credits instead of deducting the value of those credits immediately. If this legislation becomes law (it’s already passed in the House, and awaits action in the Senate), that would let companies revert to the status quo ante: fully deducting the value of those R&D tax credits right away. So for large R&D spenders, Morgan Stanley notes, “These changes could yield sizable tax refunds and higher free cash flow numbers.” Next question, obviously: Who are these big R&D spenders, ...

Earnings Report: A Final Q4 Update

Image
First quarter 2024 is now officially done, and as we all wait with baited breath for Q1 earnings reports to arrive in another two weeks or so, Calcbench wanted to take one final look at the Q4 2023 earnings numbers filed over the previous three months.  We track these earnings using our Earnings Tracker template, which pulls in financial disclosures as companies file their latest earnings releases with the Securities and Exchange Commission. The Earnings Tracker provides an up-to-the minute snapshot of financial performance compared to the year-earlier period. Figure 1, below, tells the tale. It shows total data for more than 3,500 non-financial companies that have filed Q4 earnings as of April 2.  Figure 2, below, is that same data converted into bar charts for easy visualization. So we have revenue up 1.46 percent from the year-earlier period, and net income up an impressive 22.6 percent. Moreover, cost of goods sold is actually lower than the year-earlier period by 1.88 pe...