Posts

Inventory as a Non-Current Asset

Image
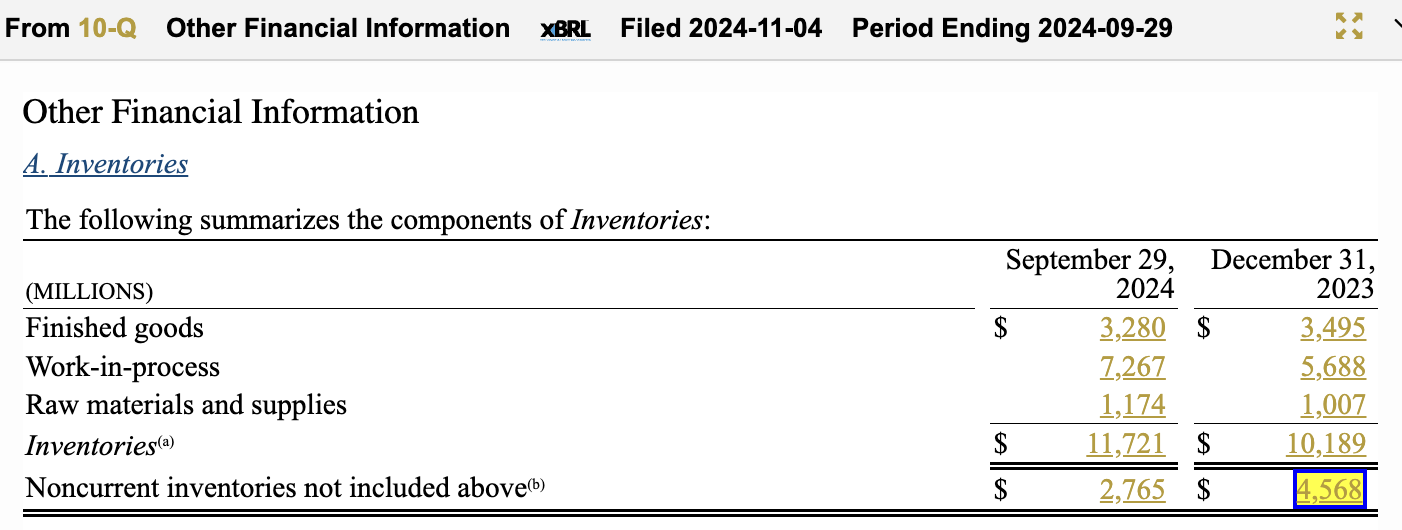
Most financial analysts think of inventory as a current asset, and in most cases you’d be correct — except for those cases where you’re not.  Turns out, more than a few companies disclose inventory as a non- current asset. The tricky part is that in many of those cases, the non-current inventory is added to “other assets.” You, the financial analyst on the outside, need to dig into the footnotes if you want to find that information.  Typically that would be a painstaking exercise — but fear not! XBRL is coming to the rescue with a dedicated XBRL tag, InventoryNoncurrent . That allows you to use Calcbench to find the item simply and quickly. So what is non-current inventory, anyway? One example of non-current inventory comes from Pfizer (PFE). The pharma giant reported $4.57 billion in non-current inventory at the end of 2023, compared to $10.19 billion of current inventory. The information was included in the Other Financial Information note, and included the following table ...

First Look at Q4 Earnings Growth

Image
Strap in, everybody! Today Calcbench kicks off our quarterly earnings analysis extravaganza, with our first visit to the Calcbench Earnings Tracker for Q4 2024.  As you may know, we track these earnings using our Earnings Tracker template, which pulls in financial disclosures as companies file their latest earnings releases with the Securities and Exchange Commission. The Earnings Tracker provides an up-to-the minute snapshot of financial performance compared to the year-earlier period. Today is our first look at fourth-quarter numbers. At close of business on Friday, Jan. 31, we had Q4 filings for roughly 360 non-financial firms. Revenue was up a bit from the year-ago quarter, net income was up more, capex even more than that. See Figure 1, below. Interesting to see that the cost of revenue declined 3.94 percent, because we’re always looking for signs of inflation and that’s where said signs would appear. Then again, we only have a relative handful of firms reporting data so far; ...

General Motors Reports $5.2 Billion of Earnings Adjustments

Image
General Motors filed its latest earnings release on Tuesday morning — and for all you students of non-GAAP adjustments to earnings, you have plenty to study here.  The headline net income number from GM’s filing was a net loss of $2.96 billion for the fourth quarter, a huge swing from $2.1 billion in net income from the year-ago period. That said, GM then proceeded to add back $5.2 billion in adjustments, which led to non-GAAP adjusted net income of $2.51 billion for the quarter.  What were those adjustments? Using the Export Data Tables feature that we’ve discussed previously , Calcbench pulled each one from GM’s earnings release and listed them all in table format. See Figure 1, below. As you can see, the single largest adjustment was a $4.01 billion restructuring charge GM declared to extricate itself from joint-venture business in China. The company also declared a $500 million restructuring charge stemming from its decision ( announced last month ) to get out of the robo...

Airline Fuel Costs Now Descending

Image
The airline industry has been filing Q4 and year-end 2024 earnings releases fast and furious this week, and that’s always a fun time here at Calcbench. Why? Because airline earnings releases are full of exotic disclosures (GAAP and non-GAAP alike), which gives us yet another excellent opportunity to dive into the data. Perhaps the most important non-GAAP earnings disclosure from airlines is total revenue per available seat mile, known as TRASM — but we’ve written about TRASM plenty of times before , so today we’re looking at another metric: average fuel cost per gallon. This is a non-GAAP disclosure that all major airlines report. We like it because fuel is one of the single largest expenses an airline has, and average cost per gallon gives you a normalized sense of that cost pressure over time. You can find it via the Disclosures & Footnotes page ; just pull up the airline’s earnings release and search for “fuel” or “gallon” and you’ll find it momentarily. Figure 1, below, charts ...

More Analytics - Prologis and Occupancy

Image
Another day, another Q4 earnings release, another dollop of financial analysis to show what’s possible in the wide world of Calcbench! This time we turned our eyes to Prologis ($PLD), which owns and operates logistics real estate around the world— think data centers, distribution hubs, and the like. Prologis reports as a real estate investment fund, a sector that has a unique set of metrics such as FFO (funds from operations), AFFO (adjusted funds from operations), occupancy rates, and more.  Prologis filed its Q4 and full-year 2024 earnings release this morning . We started reading, and found this table of operating performance metrics on the first page:   Average occupancy of 95.6 percent certainly seems high at first glance, but how has that metric performed over time? Using the Export Data Tables feature from our Recent Filings page (a shortcut we explained on these blog pages last week ) we pulled average occupancy rates for each of Prologis’ last 12 quarters. The result...

Exposure to Medicare Drug Negotiations

Image
Today, the final working day of the Biden Administration, the Department of Health & Human Services announced that it had added 15 more drugs to its Medicare Drug Price Negotiation Program , to see how much the federal government can pressure pharmaceutical companies into lowering their prices.  Obvious question for financial analysts: which firms make these drugs, and how important are those products to the company’s total revenue?  Don’t worry — Calcbench figured it out for you! Pharmaceutical firms are required to report annual sales of their blockbuster drugs as individual operating segments of the whole business. So we just took the list of drugs newly added to the Medicare Negotiation program, identified who sells them, and then looked up each drug’s individual revenue. The result is Table 1, below. As you can see, some of the drugs are major revenue sources for their respective manufacture. Xifaxan, used to treat diarrhea, accounted for 20 percent of Bausch Cos. ’ ...

UnitedHealth in Four Charts

Image
UnitedHealth Corp. ($UNH) filed its Q4 and full-year 2024 earnings release today . The release did not discuss the Dec. 4 murder of Brian Thompson, chief executive officer of the company’s single largest operating unit — so Calcbench extends our condolences to Thompson’s loved ones, and will otherwise follow the company’s lead and focus on its recent financial performance. Figure 1, below, shows UnitedHealth’s total revenue for the last eight quarters. As one can see, revenue in 2024 was up appreciably from 2023.  Figure 2 shows that quarterly revenue broken down by business unit. To little surprise, insurance premiums accounted for the solid majority of all company revenue.  That’s how the money is coming in. Figure 3, below, shows how it’s going out: UnitedHealth operating expenses for the last eight quarters. Again to little surprise, most of UnitedHealth’s costs go toward paying medical claims.  Lastly, we wanted to understand medical costs as a portion of revenue. F...