Posts

Another Way to Study Share Buybacks
Image
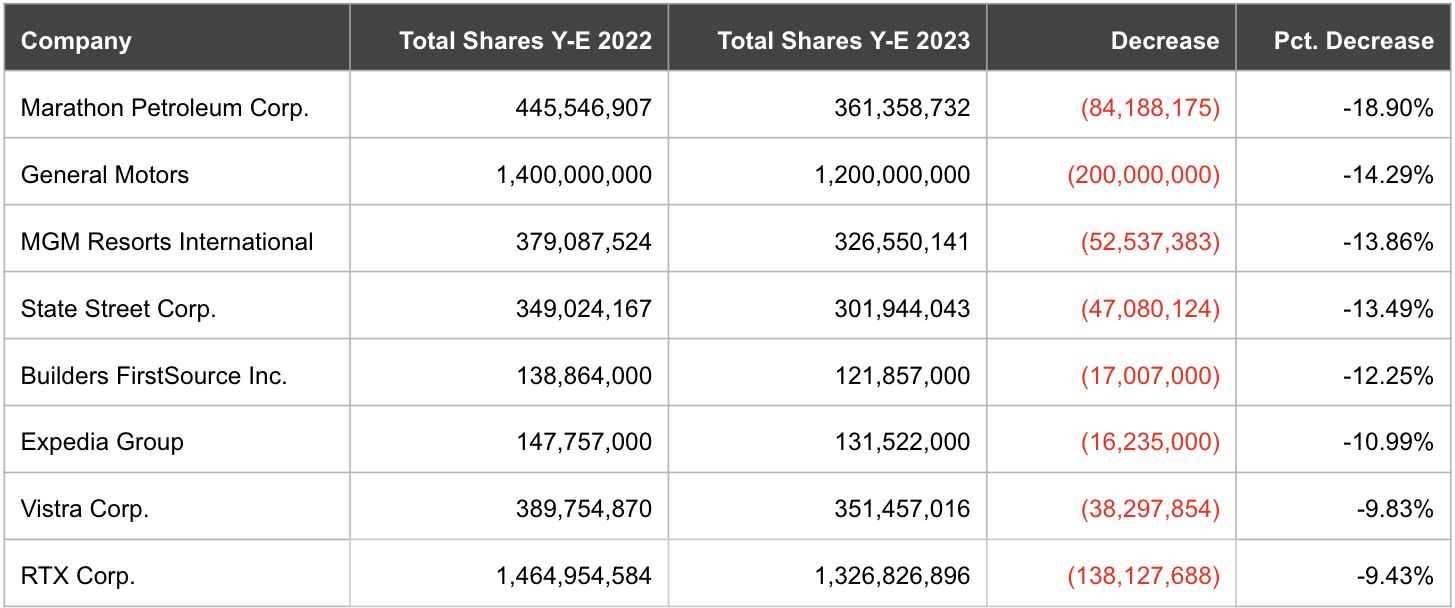
Yes, yes — companies spend gobs of money on share repurchase programs. Everybody knows that already. You might even know that already thanks to previous research Calcbench has published on share buybacks, including an in-depth analysis in 2022 , an earlier analysis in 2018 , or other reports we’ve published over the years.  Today we offer a fresh take on repurchase programs — looking at the number of shares repurchased, rather than the money spent repurchasing them. Here’s what we did. Looking at the S&P 500, we compared the number of shares a company had outstanding at the end of 2022 to shares outstanding at the end of 2023. That tells us how many shares “vanished” from the company last year, either through repurchasing programs or some other means.  Divide that number of vanished shares into the total outstanding at the end of 2022, and you can determine how much a company’s total share pool shrank in 2023.  Figure 1, below, tells the tale. It lists the eight firms...

Easier SEC Disclosure NLP with Standardized HTML

Image
Ingesting SEC disclosures for algorithmic natural language processing (NLP) is difficult because the HTML is poorly formed.  Now Calcbench API users can access standardized disclosure HTML. For instance, Microsoft's Contingencies note looks like this  - but the HTML looks like this - everything is a paragraph, there is no hierarchy, the headers are not headers. Calcbench's standardized HTML looks like this - The hierarchy of headers headers is correct and they are in sections with the text to which they refer. To get the standardized HTML use the disclosure API (Calcbench API access required) and pass the standardized=True to the DisclosureSearchResults objects returned by the disclosure_search method , documentation . See the  example notebook .

Non-GAAP Net Income Adjustments by Industry

Image
We want to squeeze in one more post about our analysis of non-GAAP adjustments to net income, this time examining trends in non-GAAP net income by industry. First let’s review the broader non-GAAP net income scene. As you might recall, several weeks ago Calcbench released our annual report on non-GAAP adjustments , looking at the adjustments of 260 randomly selected firms in the S&P 500. We found an average of 6.3 adjustments per company. Those adjustments pushed up non-GAAP net income by an average of $698 million per firm, 29 percent higher than traditional GAAP net income.  You can download the full analysis from our Research page — and this year, for the first time, we also have a secondary report devoted specifically to non-GAAP adjustments by industry .  So what were some of the more interesting findings in that industry report? Let’s take a look. First, we did find that some industries had larger non-GAAP adjustments than others . We did this by sorting our sample ...

Campbell’s Big Bet on Rao’s Sauce

Image
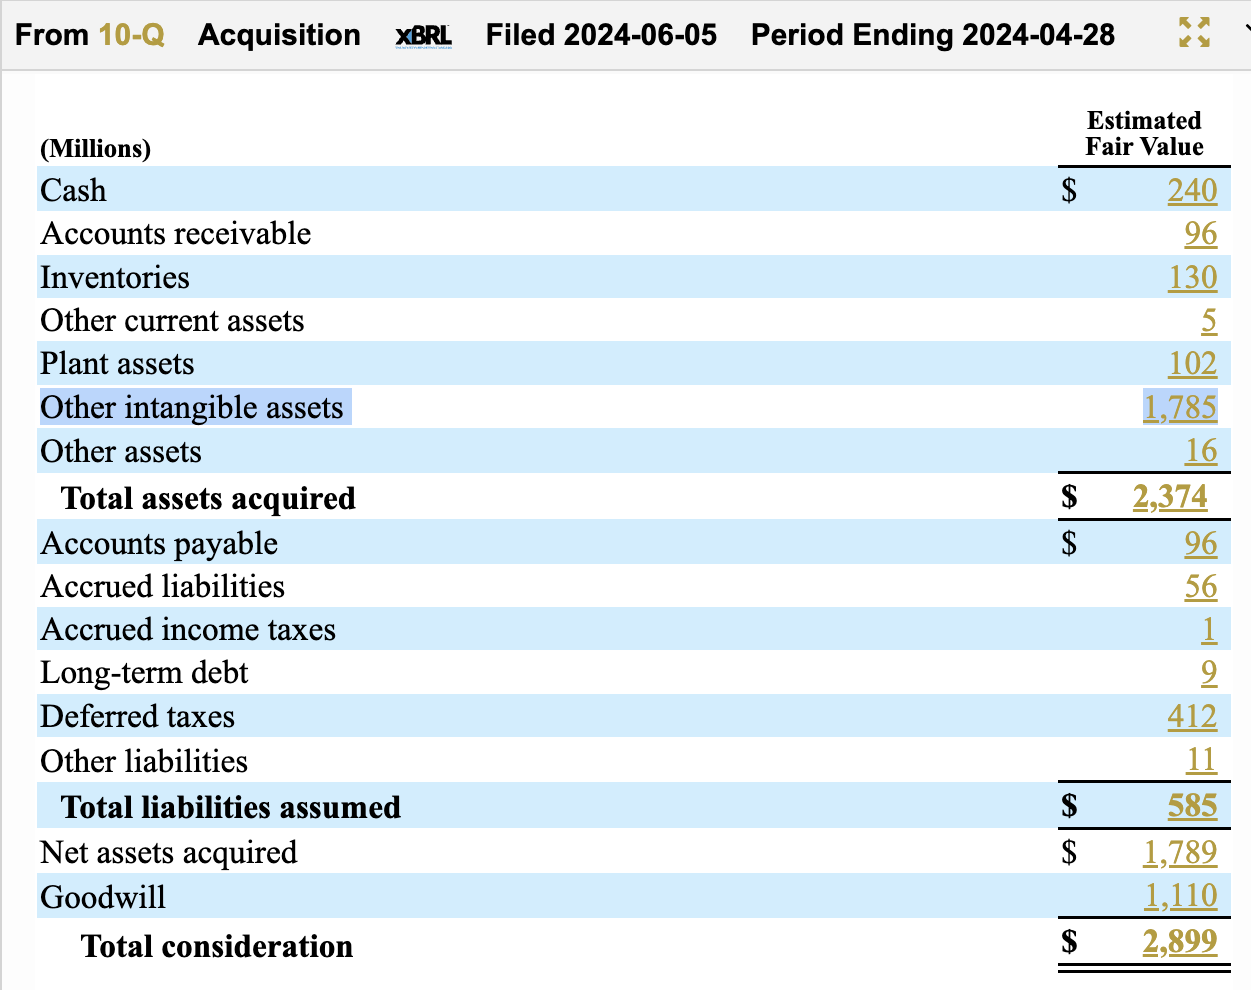
Look, Calcbench enjoys good food just as much as the next person, and we often buy Rao’s pasta saunce at the supermarket — but holy cow, does Campbell Soup Co. have that much faith in the brand?  We ask because Campbell ($CPB) just filed its latest report , for its fiscal quarter ending April 30. The filing included the details of how Campbell accounted for its $2.9 billion acquisition of Sovos Brands , previously owner of Rao’s Homemade pasta sauce and various smaller food brands. The deal closed on March 12. Calcbench users can find purchase price allocation details using our Disclosures and Footnotes database ; just find the company in question and then select the Business Combinations and Acquisitions footnote from the pull-down menu on the left-hand side of your screen. We did that for Campbell, and found the following purchase price allocation for the Sovos deal: OK, let’s do some math. Campbell acquired $2.37 billion in Sovos assets, and also $585 million in liabilities. N...

Research on Net Operating Losses

Image
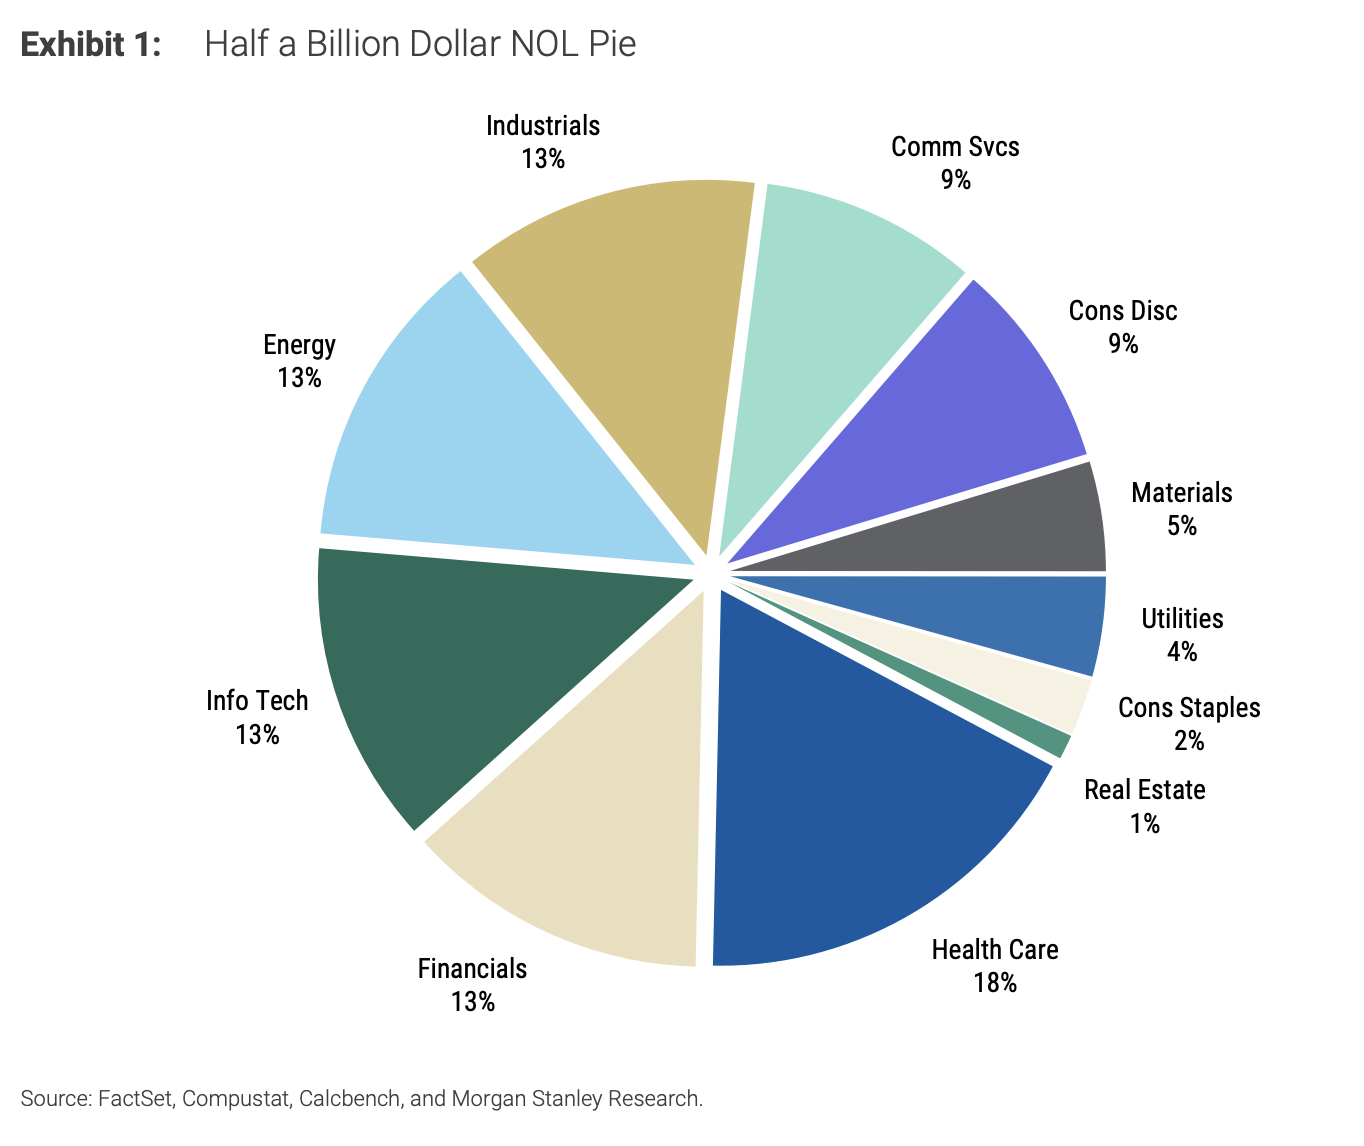
Today we have another example of Calcbench used in the field: a research note from Morgan Stanley that used Calcbench data to identify net operating losses that companies carry on their books, and which the companies can then use to lower taxable income in future years.  A net operating loss (NOL) happens when a company incurs a tax loss in some given year. The NOL can then be carried forward to reduce taxable income in future years, which makes NOLs a nifty thing to keep on the books. As the Morgan Stanley research note observed , the potential cash tax savings offer “a real and significant economic value” to a company or acquiring business. OK, sounds cool — so which companies have NOLs on the books?  That was the question Morgan Stanley explored, using data from Calcbench and other less-cool sources. Research analyst Todd Castagno found that U.S. companies had roughly $510 billion of NOLs at the end of 2023. The NOLs were concentrated in healthcare (18 percent), financials ...

Amortization of Intangibles and Non-GAAP Net Income

Image
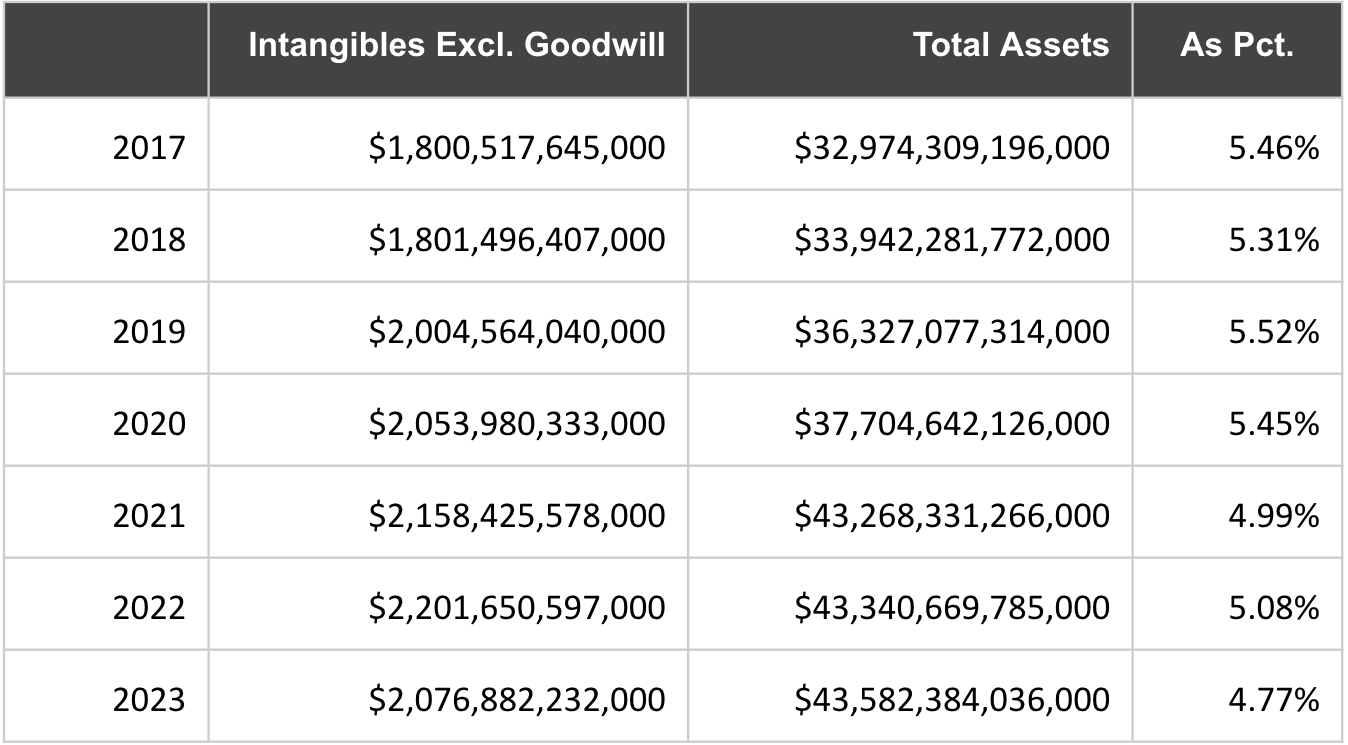
As you might have seen, last week Calcbench published our annual analysis of non-GAAP adjustments to net income — and as usual, amortization of intangible assets accounted for a significant portion of all non-GAAP adjustments. Specifically, among the 260 randomly selected S&P 500 firms that we studied, we identified 147 adjustments related to amortization of intangible assets, worth a total of $60.5 billion. That was the largest single category of non-GAAP adjustment by far, roughly one-third of the whole $181.5 billion in non-GAAP adjustments to net income that we identified. Moreover, amortization of intangibles has been one of the largest categories of non-GAAP adjustments for three years running. Even in 2022, when goodwill impairments were the single largest category of adjustment, amortization of intangibles still placed a strong second. Now that inflation and impairments are behind us, amortization is back on top as usual. We should pause to understand why that is.  Fir...

Non-GAAP Adjustments, Part II: Big Adjusters

Image
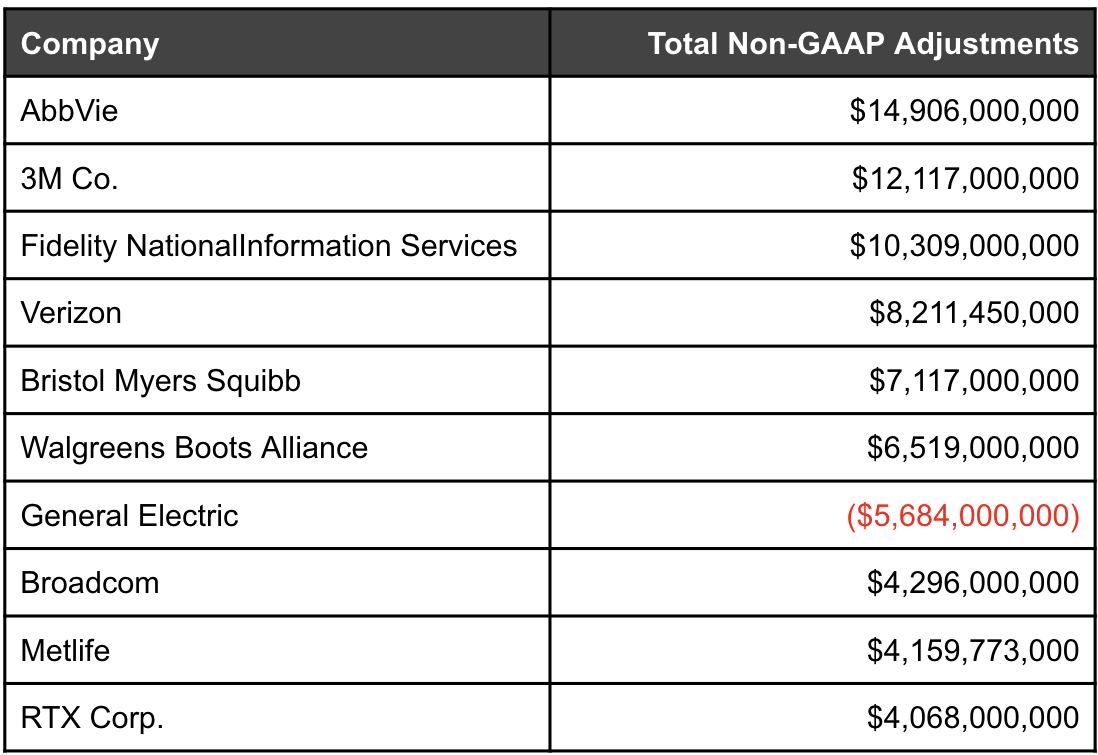
Today we continue our look at non-GAAP adjustments to net income with a fan favorite — a list of the 10 companies with the biggest non-GAAP adjustments to net income in 2023! Today’s report builds on the non-GAAP analysis we released earlier this week , documenting how 260 randomly selected firms in the S&P 500 reported non-GAAP net income for 2023. Our primary findings from that report were that non-GAAP adjustments actually fell in 2023 compared to 2022. The average total value of adjustments per company was $698 million, compared to $1.08 billion in 2022. The average adjustment itself, meanwhile, fell from $184 million to $110.8 million. Now the good stuff: Who made the biggest adjustments?  Our table below provides the answer. It lists the 10 companies that reported the largest total non-GAAP adjustments in 2023.  Notice that seventh entry from General Electric ($GE) printed in red. GE did indeed have one of the largest non-GAAP adjustments we saw in 2023, but that ...