Posts

Showing posts from January, 2025

General Motors Reports $5.2 Billion of Earnings Adjustments

Image
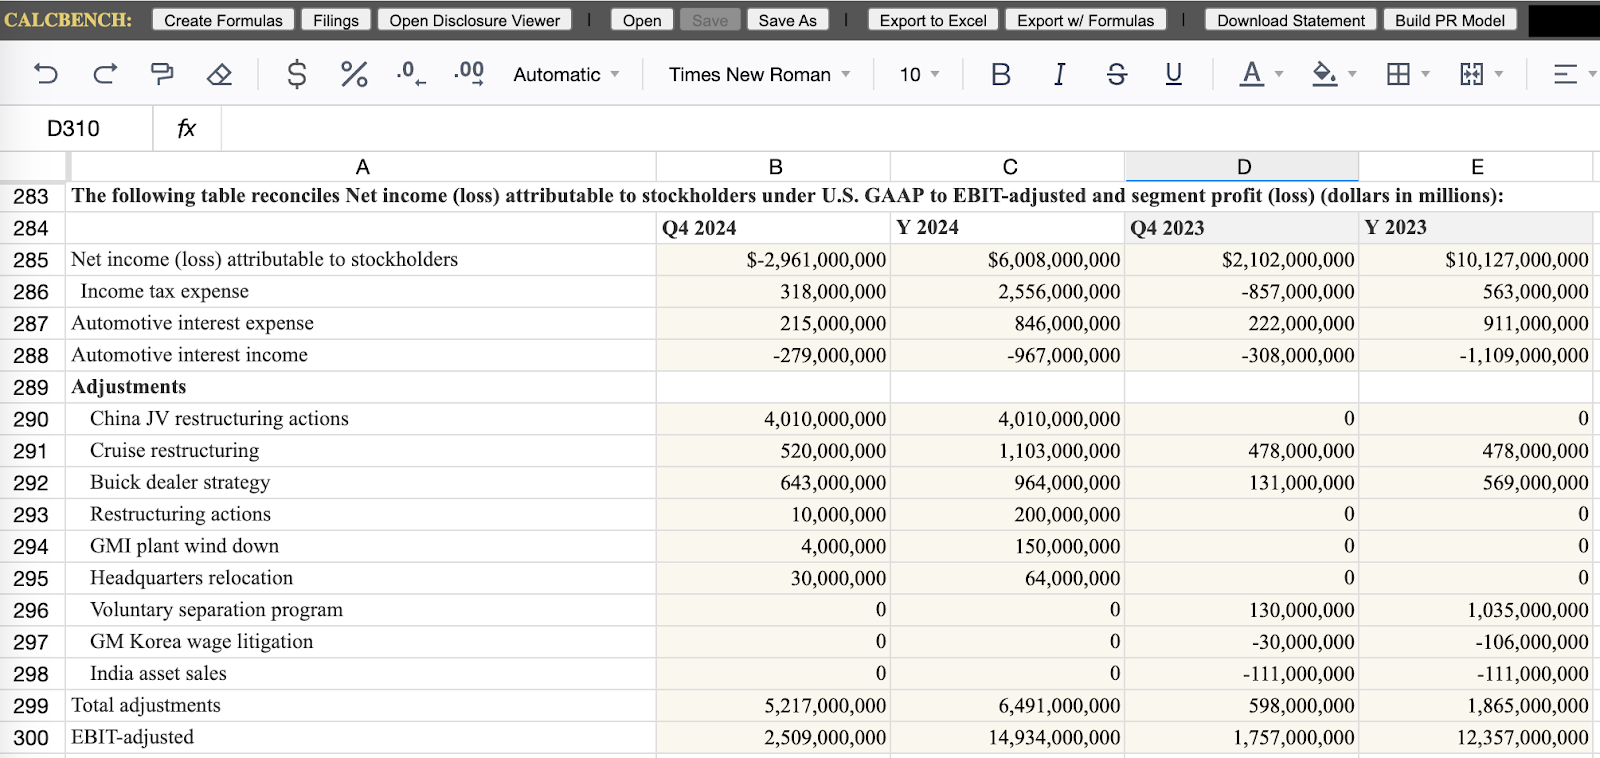
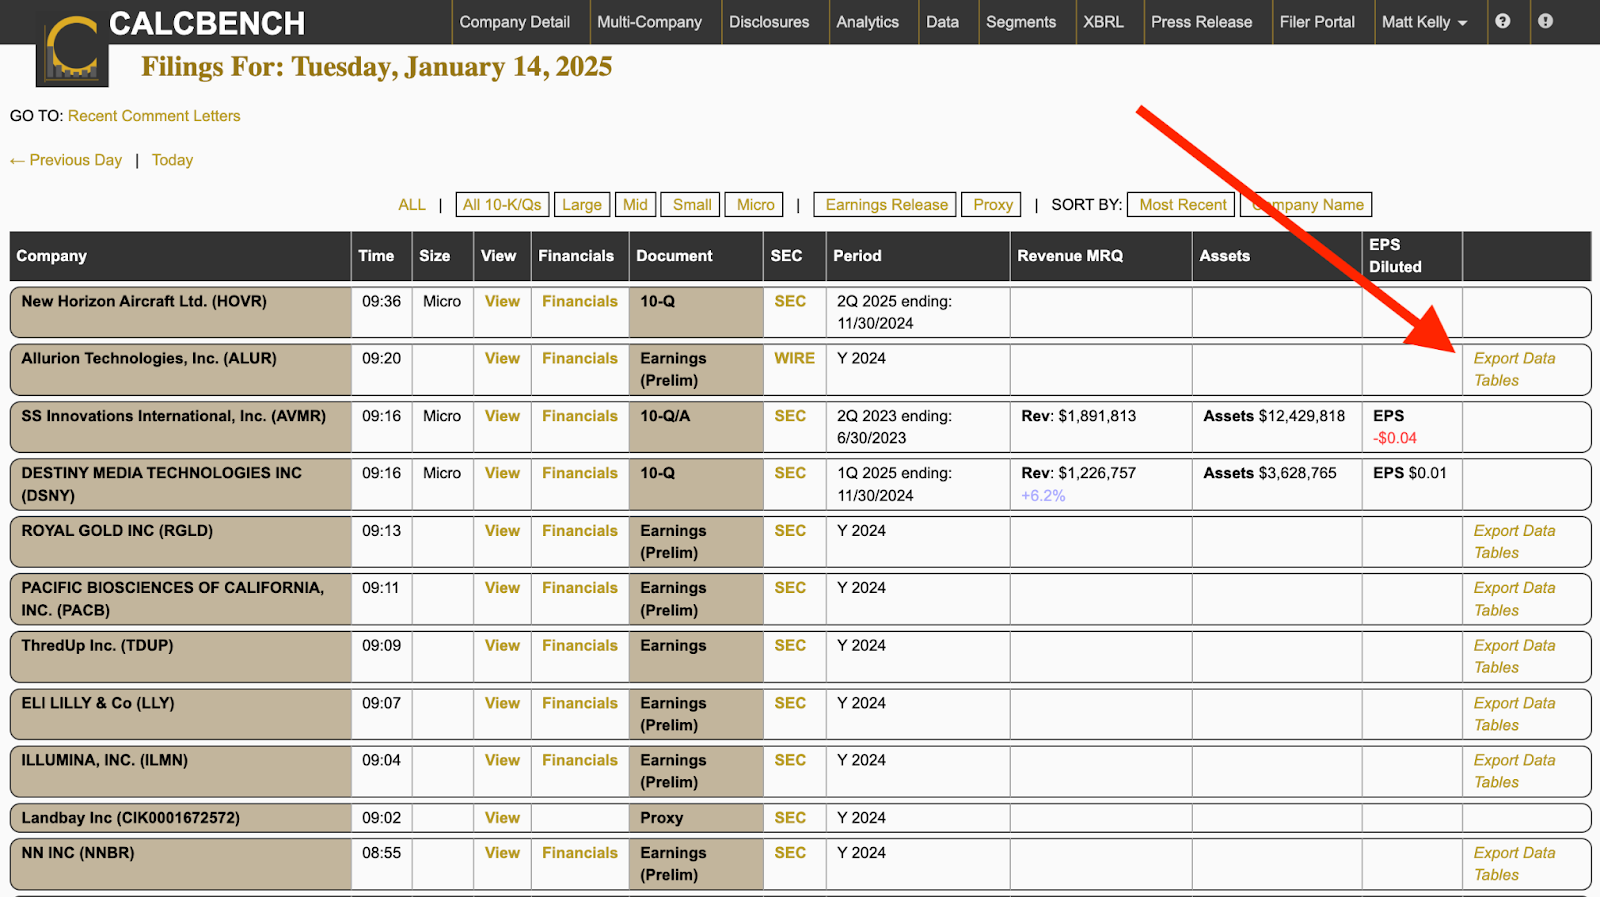
General Motors filed its latest earnings release on Tuesday morning — and for all you students of non-GAAP adjustments to earnings, you have plenty to study here.  The headline net income number from GM’s filing was a net loss of $2.96 billion for the fourth quarter, a huge swing from $2.1 billion in net income from the year-ago period. That said, GM then proceeded to add back $5.2 billion in adjustments, which led to non-GAAP adjusted net income of $2.51 billion for the quarter.  What were those adjustments? Using the Export Data Tables feature that we’ve discussed previously , Calcbench pulled each one from GM’s earnings release and listed them all in table format. See Figure 1, below. As you can see, the single largest adjustment was a $4.01 billion restructuring charge GM declared to extricate itself from joint-venture business in China. The company also declared a $500 million restructuring charge stemming from its decision ( announced last month ) to get out of the robo...

Airline Fuel Costs Now Descending

Image
The airline industry has been filing Q4 and year-end 2024 earnings releases fast and furious this week, and that’s always a fun time here at Calcbench. Why? Because airline earnings releases are full of exotic disclosures (GAAP and non-GAAP alike), which gives us yet another excellent opportunity to dive into the data. Perhaps the most important non-GAAP earnings disclosure from airlines is total revenue per available seat mile, known as TRASM — but we’ve written about TRASM plenty of times before , so today we’re looking at another metric: average fuel cost per gallon. This is a non-GAAP disclosure that all major airlines report. We like it because fuel is one of the single largest expenses an airline has, and average cost per gallon gives you a normalized sense of that cost pressure over time. You can find it via the Disclosures & Footnotes page ; just pull up the airline’s earnings release and search for “fuel” or “gallon” and you’ll find it momentarily. Figure 1, below, charts ...

More Analytics - Prologis and Occupancy

Image
Another day, another Q4 earnings release, another dollop of financial analysis to show what’s possible in the wide world of Calcbench! This time we turned our eyes to Prologis ($PLD), which owns and operates logistics real estate around the world— think data centers, distribution hubs, and the like. Prologis reports as a real estate investment fund, a sector that has a unique set of metrics such as FFO (funds from operations), AFFO (adjusted funds from operations), occupancy rates, and more.  Prologis filed its Q4 and full-year 2024 earnings release this morning . We started reading, and found this table of operating performance metrics on the first page:   Average occupancy of 95.6 percent certainly seems high at first glance, but how has that metric performed over time? Using the Export Data Tables feature from our Recent Filings page (a shortcut we explained on these blog pages last week ) we pulled average occupancy rates for each of Prologis’ last 12 quarters. The result...

Exposure to Medicare Drug Negotiations

Image
Today, the final working day of the Biden Administration, the Department of Health & Human Services announced that it had added 15 more drugs to its Medicare Drug Price Negotiation Program , to see how much the federal government can pressure pharmaceutical companies into lowering their prices.  Obvious question for financial analysts: which firms make these drugs, and how important are those products to the company’s total revenue?  Don’t worry — Calcbench figured it out for you! Pharmaceutical firms are required to report annual sales of their blockbuster drugs as individual operating segments of the whole business. So we just took the list of drugs newly added to the Medicare Negotiation program, identified who sells them, and then looked up each drug’s individual revenue. The result is Table 1, below. As you can see, some of the drugs are major revenue sources for their respective manufacture. Xifaxan, used to treat diarrhea, accounted for 20 percent of Bausch Cos. ’ ...

UnitedHealth in Four Charts

Image
UnitedHealth Corp. ($UNH) filed its Q4 and full-year 2024 earnings release today . The release did not discuss the Dec. 4 murder of Brian Thompson, chief executive officer of the company’s single largest operating unit — so Calcbench extends our condolences to Thompson’s loved ones, and will otherwise follow the company’s lead and focus on its recent financial performance. Figure 1, below, shows UnitedHealth’s total revenue for the last eight quarters. As one can see, revenue in 2024 was up appreciably from 2023.  Figure 2 shows that quarterly revenue broken down by business unit. To little surprise, insurance premiums accounted for the solid majority of all company revenue.  That’s how the money is coming in. Figure 3, below, shows how it’s going out: UnitedHealth operating expenses for the last eight quarters. Again to little surprise, most of UnitedHealth’s costs go toward paying medical claims.  Lastly, we wanted to understand medical costs as a portion of revenue. F...

Bank of America: What We Learned (hint - it's in the loan book)

Image
Bank of America (BAC) reported their earnings for 2024 this morning and Calcbench has all the data you might want. Net Income increased by $637M in 2024 compared to 2023, an increase of 2.56%. Digging deeper, it is interesting to note that this increase in Net Income is in spite of a substantial increase in their net charge offs. Net charge offs increased from $3.799B in 2023 to $6.031B in 2024, an increase of $2.232B or 58.75%. An even deeper dive into the numbers allows us to examine the areas in which BAC is experiencing these charge offs. The vast majority seem to stem from the consumer banking segment, specifically, credit cards. Net charge offs on credit cards increased from $2.561B in 2023 to $3.745B in 2024, an increase of $1.184B or 46.23%. Some other areas also showed some significant increases. For example, Commercial Real Estate related charge offs increased by 252% (from $245M in 2023 to $864M in 2024), U.S. Commercial related charge offs increased by 213% (from $124M in 2...

Another Analysis Shortcut From Calcbench

Image
As we all wait for Q4 and full-year 2024 earnings to arrive, Calcbench wanted to share yet another way that subscribers can quickly find, analyze, and export all that financial data companies report. We got you covered. Start with our Recent Filings page , which tracks and indexes corporate filings typically within a few minutes of those filings arriving at the Securities and Exchange Commission. For many companies (and almost all large ones), you’ll see an option on the far right side of your screen that says Export Data Tables. See Figure 1, below. If you click on that Export Data Tables option, Calcbench will then open a new tab displaying all the table data from the company you’ve chosen in spreadsheet format. We randomly selected Calumet ($CLMT), a solvents manufacturer that filed preliminary earnings results on Jan. 14 , to see what would come up. The result is Figure 2, below. OK, a quick table to reconcile Calumet’s estimated net loss for Q4 to the company’s Adjusted EBITDA. C...

Earnings Season Takes Off With Delta

Image
Welcome back to earnings season, everyone! Delta Air Lines ($DAL) has filed its Q4 and full-year 2024 earnings release — and with that filing, we are off to the races again!  We always love Delta earnings reports because they’re a great example of the non-GAAP disclosures that companies make, and which Calcbench tracks. In the airline world, two critical non-GAAP disclosures are total revenue per available seat mile (TRASM) and cost per available seat mile (CASM). Just about every major airline reports those two items in their earnings releases, including Delta.  Calcbench indexes both disclosures, so you can track them through time using our See Tag History feature. We did precisely that, and the result is Figure 1, below.  As you can see, TRASM has generally stayed above CASM for the last three years, except for a brief period at the start of 2022 (when inflation was all the rage).  The airlines publish lots of other nuggets too, such as fuel expense ($2.41 billi...

The Wealth of Standardized Data in Calcbench

Image
Calcbench offers a huge amount of data to our subscribers, and sometimes that’s all a subscriber wants — reams and reams of historical data, that you can use to populate your own models and analytical tools.  Today we wanted to give curious readers a quick look at how that works. The place to start is our Standardized Metrics page .  This page lists all the specific pieces of financial data that Calcbench tracks: nearly 1,500 items, from universally known disclosures reported by everyone on the primary financial statements, to some truly obscure stuff disclosed by a relative few companies, only in the footnotes.  When you first arrive at the Standardized Metrics page, you’ll see something like Figure 1, below. From there you can expand the menu for each of those five categories of data, to see a brief description of each data item we track. See Figure 2, which shows some of the non-GAAP disclosures we track.  From there you can select or de-select the specific data ...