Posts

Showing posts from December, 2024

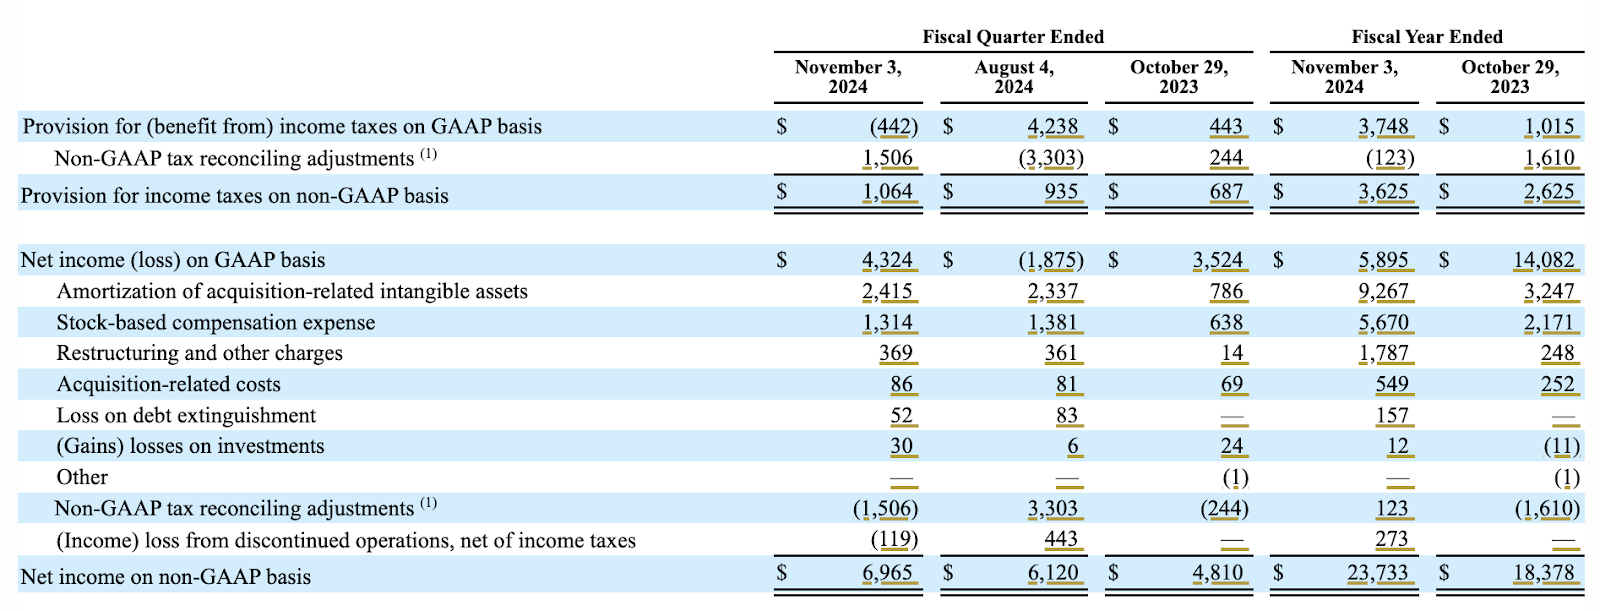
Counting Up the Tech Giants and Net Income

Image
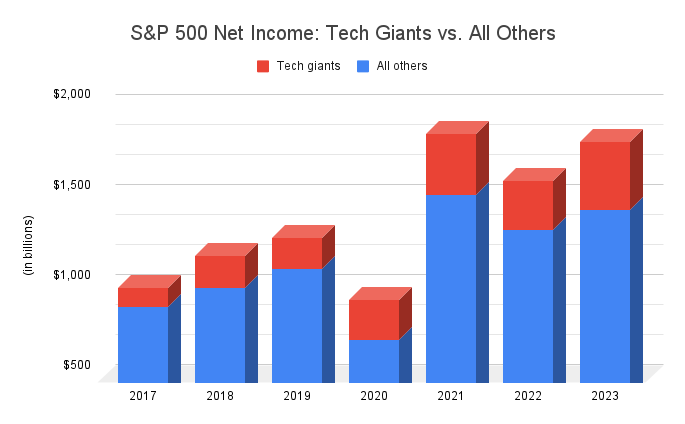
All the technology giants will be filing their 2024 annual reports by late January, and they’re all likely to report gobs and gobs of net income; but how many gobs of net income, exactly, compared to the rest of Corporate America?  After all, one popular theory in financial analysis in recent years is that earnings from the tech giants have been pulling away from the rest of large corporations, devouring an ever-larger share of total net income. So using our Multi-Company database page , the crack Calcbench research pulled net income numbers for the S&P 500 for the last seven years, and then mapped out what share of total net income went to eight tech giants compared to all other firms.  The eight firms we classified as tech giants are: Amazon ($AMZN) Apple ($AAPL) Broadcom ($AVGO) Facebook ($META) Google ($GOOG) Microsoft ($MSFT) Netflix ($NFLX) Nvidia ($NVDA) The results are in Figure 1, below. As you can see, the share of net income from the tech giants (in red) has es...

Parsing Broadcom Non-GAAP Earnings

Image
Nothing says “Christmas present” to Calcbench like a complicated non-GAAP net income disclosure, replete with adjustments just begging to be analyzed — and sure enough, Broadcom ($AVGO) delivered the other day with its 2024 annual report! We can start with a look at the earnings release, filed on Dec. 12 . The semiconduct giant reported $51.57 billion in revenue, up 44 percent from the prior year; operating income of $13.46 billion, a decline of 17 percent; and net income of $5.89 billion, down 58 percent.  Except, those are the boring old GAAP numbers. Read further down the earnings release and you arrive at adjusted, non-GAAP numbers, and they tell quite a different tale. See Figure 1, below.  Broadcom booked so many adjustments, of such large size, that its GAAP net income of $5.89 billion transformed into non-GAAP net income of $23.73 billion — up 29 percent from $18.79 billion in non-GAAP net income for the prior year.  One can see the line-item adjustments driving ...

Krispy Kreme Gets Squeezed

You may have missed this while eating your kale salad, but on Dec. 12 Krispy Kreme ($DNUT) filed an 8-K announcing that the company has suffered some sort of material cybersecurity event . What happened, exactly? We’re not sure, and it seems that Krispy Kreme isn’t either. The company only disclosed that on Nov. 29 it was “ notified regarding unauthorized activity on a portion of its information technology systems… The company is experiencing certain operational disruptions, including with online ordering in parts of the United States. Daily fresh deliveries to our retail and restaurant partners are uninterrupted.” OK, that’s not good. Krispy Kreme then continued, saying that the attack “has had and is reasonably likely to have a material impact on the company’s business operations until recovery efforts are completed. The expected costs related to the incident… are reasonably likely to have a material impact on the company’s results of operations and financial condition.” That disclos...

How Calcbench Pro Subscribers Can Build An Earnings Model In Seconds

Image
 Want to build a simple earnings model in seconds? We’ve got you covered. To start, we’ll a look at new earnings releases for today (Thursday December 12). (alternatively you can choose any company you want from the dropdown at https://www.calcbench.com/detail ) Any earnings release that has data in table form will have an “ Export Data Tables ” link all the way to the right. Click this to start. What you will immediately get is an online spreadsheet. If you haven’t used our online spreadsheet tool before, you’ll have to log in with your Calcbench credentials. All of the data tables from the earnings release will appear in the spreadsheet. Now the fun begins. Click on the Build PR Model menu button on the top menu bar. Merge in previous period earnings releases to build a history.  You can choose to remove any tables that don’t interest you, and do some formatting. Pretty soon you have a complete model in full as reported line item detail.       ...

A Word on Financial KPIs

Image
Everyone appreciates having more useful financial data to analyze — but exactly where do those financial disclosures come from? Who decides what those metrics are?  Typically that work falls to the Financial Accounting Standards Board (FASB), and they have some fresh news on that front. FASB is working on a new project to study financial key performance indicators. The group recently published a call for people in the financial analysis world   (that would be you) to comment on what makes for good financial KPIs, and we encourage our readers to give FASB’s request a read and offer your opinion. Oh, and the data that FASB used to do its preliminary research on KPIs came from Calcbench. #HumbleBrag Why is FASB undertaking this project, and why should you care? Because more and more companies are disclosing financial KPIs in their earnings releases, but those KPIs —  EBITDA, adjusted EPS, free cash flow, or various others — are not part of U.S. Generally Accepted Accounting...

Last Call for Q3 Earnings

Image
That’s all, folks — we’re calling time on earnings reports for Q3 2024, and final results paint the same mottled picture for net income and capex spending that we’ve seen for the last six weeks.  As readers of this blog know, we use the world-renowned Calcbench Earnings Tracker to collect financial disclosures as companies file their latest earnings releases with the Securities and Exchange Commission. With data from more than 3,900 non-financial firms now collected and crunched, we can offer a more complete picture of how Q3 2024 performance compares to the year-earlier period. The headline performance numbers are in Figure 1, below. As you can see, revenue is up 4.5 percent from the year-ago period, while net income is down 4.5 percent — but that decline is misleading. We previously noted that the decline in net income was driven by two specific one-time items at Intel ($INTC) and Johnson & Johnson ($JNJ) that were so huge they skewed net income for the entire sample; strike...

Charticle - Nvidia Revenue Growth

Image
It’s not news that Nvidia ($NVDA), maker of advanced chips to power artificial intelligence, is one of the most impressive companies in all the world these days. Still, when you look at Nvidia’s performance in detail — which we did over Thanksgiving break, based on the company’s recently filed third-quarter report — the results really are breathtaking. Figure 1, below, shows Nvidia’s revenue by geographic segment for the last few years.  As you can see, from the start of 2022 into mid-2023, Nvidia’s largest single market was Taiwan; but even then, the company also had an impressively even spread of revenue among the United States, China, and the rest of the world too.  That all changed at the start of this year, when the U.S. first became Nvidia’s primary geographic market — and then peeled away from all others, even as total revenue had also taken off like a rocket. In the space of nine months, the U.S. market had become hugely important for Nvidia’s success.  Then we ...