Posts

Showing posts from May, 2024

Amortization of Intangibles and Non-GAAP Net Income

Image
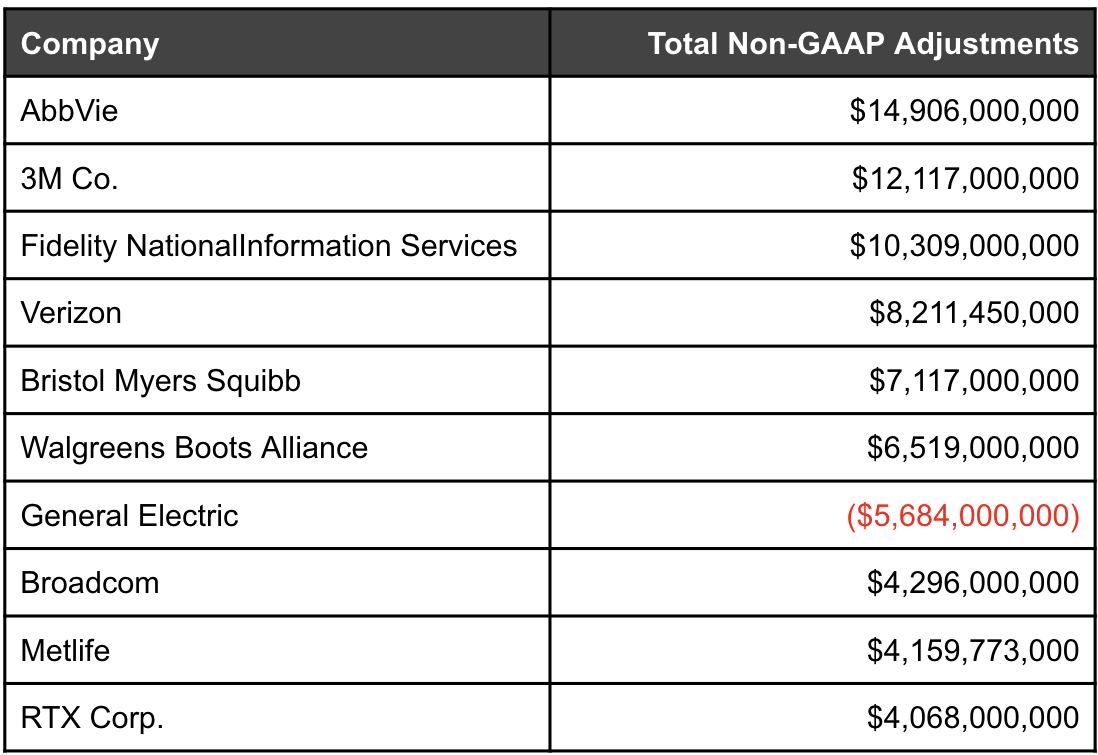
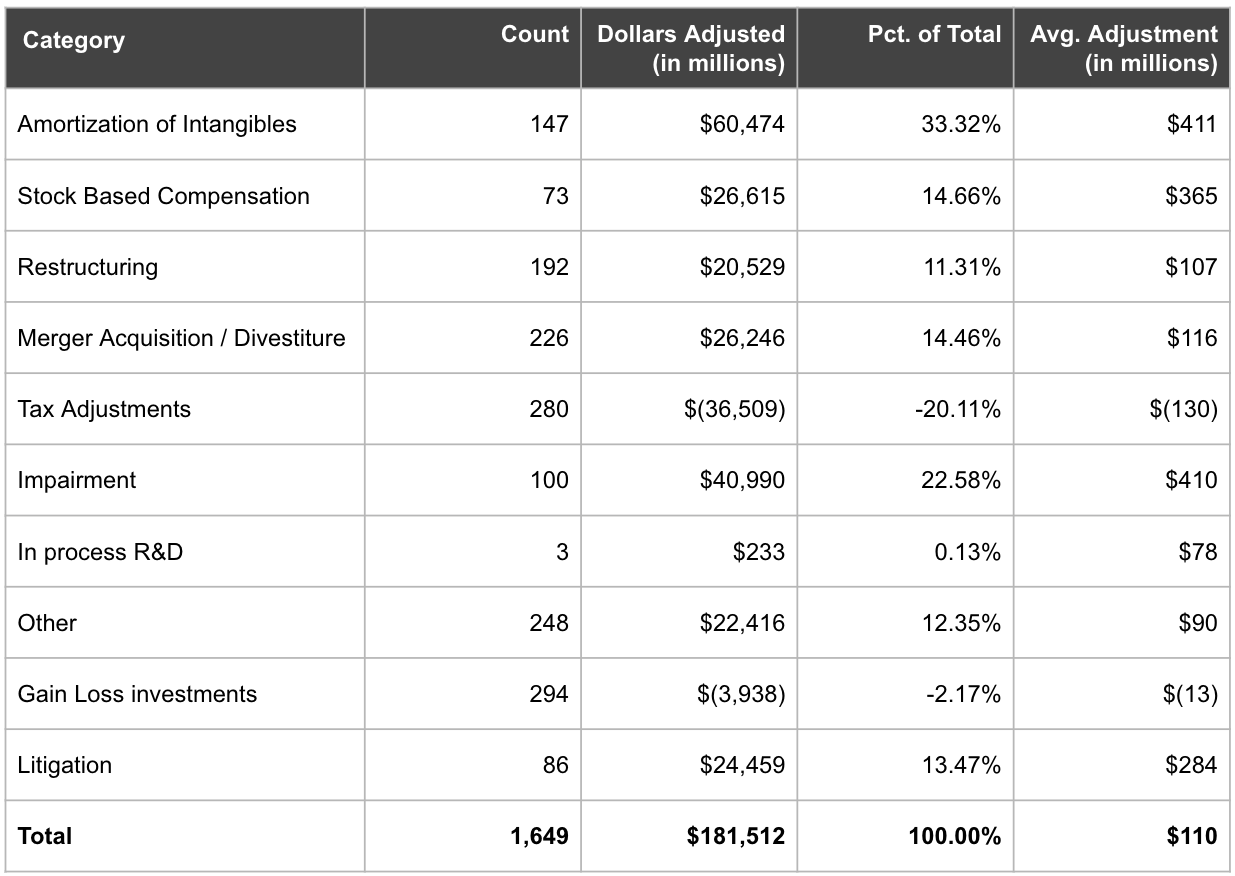
As you might have seen, last week Calcbench published our annual analysis of non-GAAP adjustments to net income — and as usual, amortization of intangible assets accounted for a significant portion of all non-GAAP adjustments. Specifically, among the 260 randomly selected S&P 500 firms that we studied, we identified 147 adjustments related to amortization of intangible assets, worth a total of $60.5 billion. That was the largest single category of non-GAAP adjustment by far, roughly one-third of the whole $181.5 billion in non-GAAP adjustments to net income that we identified. Moreover, amortization of intangibles has been one of the largest categories of non-GAAP adjustments for three years running. Even in 2022, when goodwill impairments were the single largest category of adjustment, amortization of intangibles still placed a strong second. Now that inflation and impairments are behind us, amortization is back on top as usual. We should pause to understand why that is.  Fir...

Non-GAAP Adjustments, Part II: Big Adjusters

Image
Today we continue our look at non-GAAP adjustments to net income with a fan favorite — a list of the 10 companies with the biggest non-GAAP adjustments to net income in 2023! Today’s report builds on the non-GAAP analysis we released earlier this week , documenting how 260 randomly selected firms in the S&P 500 reported non-GAAP net income for 2023. Our primary findings from that report were that non-GAAP adjustments actually fell in 2023 compared to 2022. The average total value of adjustments per company was $698 million, compared to $1.08 billion in 2022. The average adjustment itself, meanwhile, fell from $184 million to $110.8 million. Now the good stuff: Who made the biggest adjustments?  Our table below provides the answer. It lists the 10 companies that reported the largest total non-GAAP adjustments in 2023.  Notice that seventh entry from General Electric ($GE) printed in red. GE did indeed have one of the largest non-GAAP adjustments we saw in 2023, but that ...

Special Report: Non-GAAP Adjustments in 2023

Image
It’s that time of year again: Calcbench and Suffolk University have released our annual analysis of non-GAAP adjustments to net income at large companies — this year bigger and better than ever! Our study, that is. Non-GAAP adjustments to annual net income were generally not bigger and better in 2023 compared to prior years, which is our most important finding of all.  You can download the full analysis from our Research page, and don’t miss Bloomberg’s article about our findings as well. The backstory is as follows. Every spring our research team and a squad of undergraduate accounting “winterns” from Suffolk University pore over annual earnings reports for several hundred randomly selected firms in the S&P 500. The team tallies up every non-GAAP adjustment to net income it can find, groups them by type of adjustment, and then identifies which categories of adjustment are (1) most common; and (2) the largest by total dollars adjusted. This year we examined the 2023 earnings...

Banks Continue to Feel a Squeeze

Image
As the week’s earnings reports come to a close, we wanted to devote today’s post specifically to the banking industry — which is still feeling the pressure of tight net interest margins and non-performing assets. Calcbench maintains a template that tracks the disclosures banks make in their earnings releases, and we now have Q1 2024 data for more than 200 banks. So what do the trends tell us so far?  Figure 1, below, shows the ratio of non-performing assets as a percentage of total assets. As you can see, that percentage has been gliding upward since mid-2023 and continued to do so in the first three months of this year. Nothing to panic about; percentage levels are still well below 1 percent of all assets. Then again, it also depends on the bank; institutions with high exposure to commercial real estate might face higher “NPA” levels than those with less exposure. It’s a good thing that we had a post earlier this year about how to track banks’ exposure to commercial real estate. ...

A Comment (Letter) on Intangible Amortization

Image
Calcbench tracks SEC comment letters as those letters become public, and we noticed that Dolby Laboratories ($DLB) had a comment letter published earlier this week. We decided to take a look. In that letter (dated 28 Feb. 28 2024, but the SEC typically waits weeks before releasing comment letters publicly), SEC staff asked Dolby several questions about its 10-K report filed last November and the company’s accompanying earnings release. Specifically, the SEC asked Dolby to explain its non-GAAP net income number, which included an adjustment for amortization of acquisition-related intangible assets.  The SEC wanted to know why Dolby recognized only part of its amortization expense, and told Dolby to provide “more robust disclosure explaining why management believes this adjustment, which excludes some, but not all, amortization expense, results in a non-GAAP measure that is useful to investors.” Wait a minute — that’s the sort of challenge where Calcbench can help! To be precise, ...

Where the Earnings Are in Q1

Image
Today we have another update from the famed Calcbench Earnings Tracker, this time trying to understand where first-quarter 2024 corporate earnings are coming from. Spoiler: big tech. Specifically, two tech giants — Microsoft ($MSFT) and Google ($GOOG) — account for 15.8 percent of all first-quarter net income reported so far by more than 1,100 non-financial companies. Indeed, total net income for the 1,144 non-financials that have filed first-quarter earnings so far actually declined compared to the year-ago period by 3.6 percent.  In other words, the software sector is propping up everyone as a whole, and Google and Microsoft are propping up the software sector specifically. That is what the Q1 2024 earnings season looks like so far. Let’s step back and look at the larger picture. Figure 1, below, shows the data from the Calcbench Earnings Tracker as of May 6.  Total revenue is up 2.26 percent, but total net income is down 3.6 percent, presumably caused by a jump in capex s...

Public Companies Audited by BF Borgers

Wild news from the auditing world this weekend: regulators have suspended an audit firm in Colorado for fabricating its work with clients. Hundreds of businesses — including for Donald Trump’s newly public Truth Social — must now scramble to find new audit firms and re-perform prior audit work. The audit firm in question is BF Borgers, along with its sole owner and engagement partner, Benjamin F. Borgers. On Friday the Securities and Exchange Commission charged both the man and the firm with “deliberate and systemic failure” to follow industry audit standards for more than 1,500 regulatory filings that Borgers reviewed from January 2021 through June 2023. According to the SEC, Borges simply took clients’ old audit workpapers, scribbled a new date across the top, and passed off those doctored pages as fresh work. Borges agreed to pay a total of $14 million ($12 million for the firm, $2 million for Borges personally) and never to practice before the SEC again. The practical upshot is t...

Quick Takes on Free Cash Flow

Image
One of the most important metrics of corporate health these days is free cash flow: the amount of cash a company still has after it pays its for routine operating expenses (opex) and capital expenditures (capex). That remaining cash (abbreviated as FCF) can pay for lofty ambitions such as R&D, acquisitions, dividends, or share buybacks. It also pays down a company’s debt load — and hence FCF is so important these days. As interest rates remain stubbornly high and many companies refinance their debts from the late 2010s at those higher rates, companies will need strong FCF to cover those larger interest payments.  So the crack Calcbench research team wondered: How has free cash flow been performing lately?  To answer that question, we visited our Multi-Company database page and pulled up free cash flow disclosures for more than 1,700 non-financial companies with annual revenue of $100 million or more. Figure 1, below, shows total free cash flow for that group for the last ...