Posts

Showing posts from March, 2024

Charticle: Dollar General Segments

Image
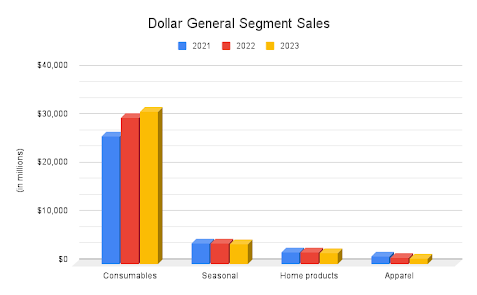
Discount retail chain Dollar General Corp. ($DG) filed its 2023 annual report this week , which piqued our interest here at Calcbench.  After all, a company so large — $38.7 billion in annual revenue, more than 20,000 stores across the United States — must have interesting things to say about consumer purchasing habits, right? So we decided to take a look. We already know what some of you might say: “Hold on, Dollar General has only one operating segment! There are no smaller segments you can examine.” Ah, but that’s not the case — if you know where to look. Turns out that while Dollar General does report only a single operating segment on the income statement, it does break out several smaller categories in an Operating Segment footnote . Using our Interactive Disclosure database, we pulled up that footnote, exported the data to Excel, and within 60 seconds had created Figure 1, below. Dollar General groups its total sales into four categories: consumables, seasonal items, home p...

A Deeper Analysis of Convertible Debt Risks

By Olga Usvyatsky Convertible debt is a hybrid security that combines elements of debt and equity. When investors buy convertible debt, they also acquire the right to convert that debt into equity shares at a specified price (the “conversion price”)  in the debt agreement. As Calcbench explained in a post from January about convertible debt, the interest rate on convertible debt is generally lower than rates paid on traditional debt. Hence convertible debt’s popularity; companies can use it to keep their interest expense down. On the other hand, when that debt does convert into equity, that “dilution event” pushes down the value of shares for all shareholders (because more shares now exist). Equity investors need to understand the terms of such deals thoroughly, so in this article let’s expand on that analysis and delve into supplemental hedging transactions that limit potential dilution. First, some background. Companies that issue convertible bonds sometimes purchase a call opt...

How to Find or Create a Peer Group

Image
Calcbench is all about helping our users perform better financial analysis — and a big part of analysis is assessing how one company performs against its peers, or how a group of companies perform over time.  To that end, today’s post is about how to create a peer group within our databases, so you can benchmark your data more quickly and easily. First, Calcbench already comes with one easy trick to find the peers of a company you’re analyzing at the moment.  For example, we visited the Company-in-Detail page , and pulled up the most recent annual statements for chipmaker Nvidia ($NVDA). Those results are below — and notice, in the upper-right corner, we have a “Related” line (see the red arrow) with a few Nvidia peers: Micron Technology , Advanced Micro Devices , Broadcom , Analog Devices , and Texas Instruments . Click on any of those ticker symbols, and we automatically pull up the same financial data for that peer company in a separate page. OK, that’s great; but most of ...

Earnings Update, Mar. 8 - Getting Into the Data

Image
  Another week down, another analysis up from the Calcbench Earnings Tracker! With well more than 2,000 earnings reports in hand, we can now do even more in-depth analysis. Our Earnings Tracker is a template we compiled using the world-famous Calcbench Excel Add-In, to pull financial disclosures automatically as companies file their latest earnings releases with the Securities and Exchange Commission.  Figure 1, below, tells the tale. It shows total data for more than 2,000 non-financial companies that have filed Q4 earnings as of noon ET March 8.  Figure 2, below, is that same data converted into bar charts for easy visualization. So we have revenue up 1.78 percent from the year-earlier period, and net income up an impressive 25.2 percent. Moreover, cost of goods sold is actually lower than the year-earlier period by 1.88 percent. We first noticed this trend two weeks ago, when our Earnings Tracker had cost of goods sold down by 0.65 percent.  Retailers in Particul...

Large Firms See China Revenues Drop

Image
  Large U.S. businesses saw their revenue from China fall 4.7 percent in 2023, according to an analysis of their geographic segment disclosures.  The Calcbench research team spent a day on our Segments disclosure database, poring over S&P 500 firms that report revenue from China. We found 52 firms that reported China revenue for both 2022 and 2023 — and collectively those revenues dropped from $246.26 billion in 2022 to $234.72 billion last year.  Table 1, below, lists the 10 companies reporting the most China revenue for the last two years. Seven of them saw revenue declines from 2022 to 2023. The picture didn’t look much better for all 52 firms, either. Thirty-four of them saw year-over-year declines in China revenue. The worst was Skyworks Solutions ($SWKS), which saw a drop of 40.2 percent. Close behind were Advanced Micro Devices ($AMD) at 34.4 percent and Micron Technology ($MU) at 34.1 percent.  We’ve shared our spreadsheet of all 52 firms on DropBox i...

Small Banks and Non-Performing Assets

Image
Small and regional banks are still very much a worry for financial analysts, policy makers, investors, and bankers themselves. Just today the Wall Street Journal had a front-page article recapping the latest unease with regional banks as they struggle with under-performing loans.  Well, Calcbench is on the case! We looked at a host of small and regional banks to see what they have been disclosing for non-performing assets, and compared those non-performing assets to total assets on the banks’ balance sheets.  The result is Figure 1, below. These are the 15 banks with the worst ratio of non-performing assets to total assets over the last 10 quarters.  For those who can’t quite see the details, the bank with the worst ratio is Blue Ridge Bancshares ($BRBS), a bank holding company based in Charlottesville, Va., with $3.18 billion in total assets. Blue Ridge had kept its ratio below 1 percent until early 2023, when the ratio spiked to 2.68 percent.  That might not seem...